

Question: need solved in May 3 # straighterline.acrobatiq.com @ 6 775% Histogram 1 400 To estimate the mean number of daily study hours in the population
need solved
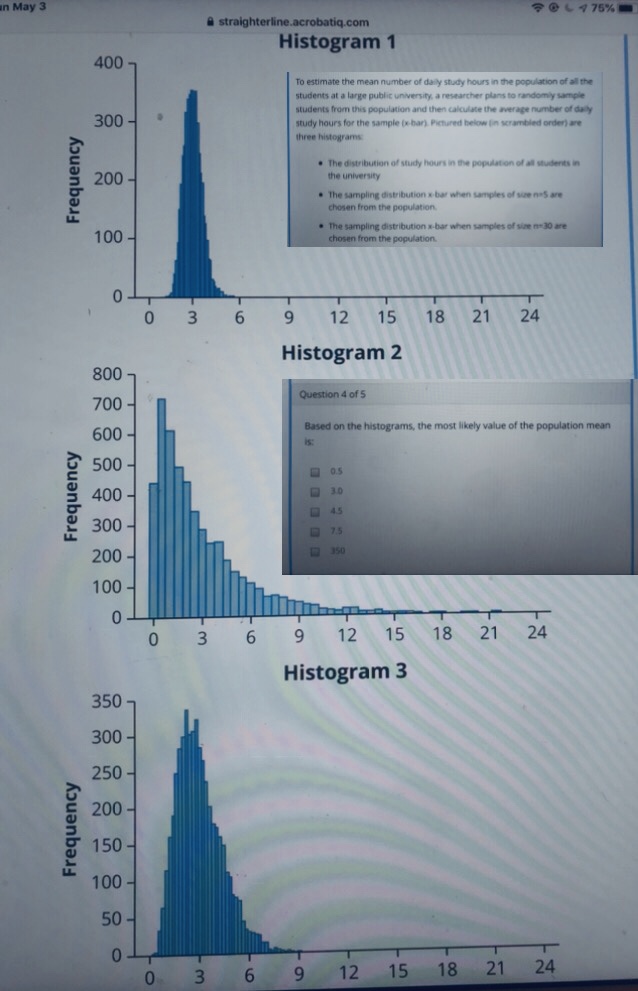
in May 3 # straighterline.acrobatiq.com @ 6 775% Histogram 1 400 To estimate the mean number of daily study hours in the population of all the students at a large public university, a researcher plans to randomly sample 300 - students from this population and then calculate the average number of daly study hours for the sample (x-bar). Pictured below [in scrambled order) are Frequency three histograms 200 - . The distribution of study hours in the population of all students in the university . The sampling distribution a bar when samples of se nas are chosen from the population. 100 - . The sampling distribution a-bar when samples of time n-30 are chosen from the population. 0 0 3 6 9 12 15 18 21 24 800 7 Histogram 2 700 Question 4 of 5 600 - Based on the histograms, the most likely value of the population mean IS: Frequency 500 - 0.5 400 - 13.0 45 300 - 1 75 200 - 350 100 - 0 0 3 6 9 12 15 18 21 24 Histogram 3 350- 300 - 250 - Frequency 200 - 150 - 100 - 50 - 0 0 3 6 9 12 15 18 21 24
Step by Step Solution
There are 3 Steps involved in it

Get step-by-step solutions from verified subject matter experts