

Question: need some assitance Problem 3: The table below shows the returns on two stocks, A and B, in each of three possible scenarios (H, M,
need some assitance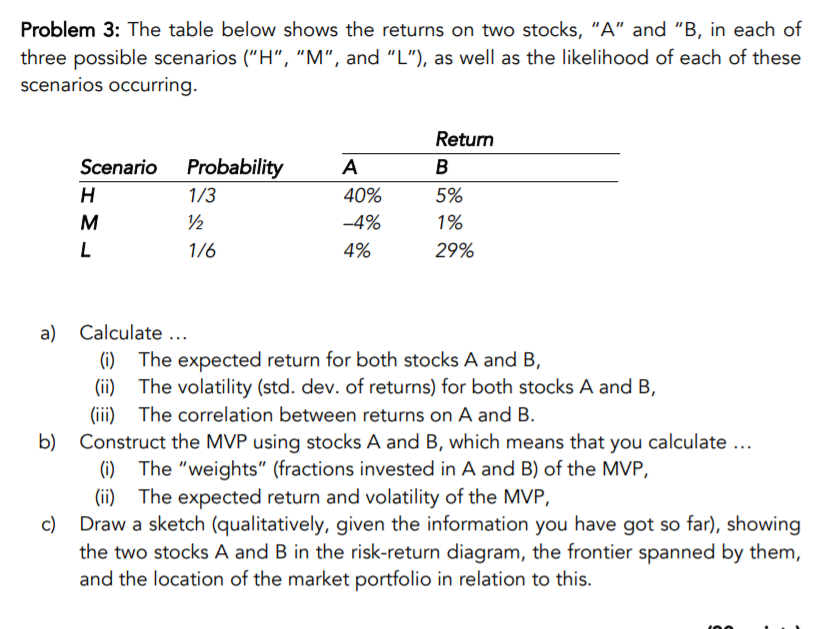
Problem 3: The table below shows the returns on two stocks, "A" and "B, in each of three possible scenarios ("H", "M", and "L"), as well as the likelihood of each of these scenarios occurring. Scenario H M L Probability 1/3 12 1/6 A 40% -4% 4% Return B 5% 1% 29% a) Calculate ... (i) The expected return for both stocks A and B, (ii) The volatility (std. dev. of returns) for both stocks A and B, (iii) The correlation between returns on A and B. b) Construct the MVP using stocks A and B, which means that you calculate ... (i) The "weights" (fractions invested in A and B) of the MVP, (ii) The expected return and volatility of the MVP, c) Draw a sketch (qualitatively, given the information you have got so far), showing the two stocks A and B in the risk-return diagram, the frontier spanned by them, and the location of the market portfolio in relation to this. Problem 3: The table below shows the returns on two stocks, "A" and "B, in each of three possible scenarios ("H", "M", and "L"), as well as the likelihood of each of these scenarios occurring. Scenario H M L Probability 1/3 12 1/6 A 40% -4% 4% Return B 5% 1% 29% a) Calculate ... (i) The expected return for both stocks A and B, (ii) The volatility (std. dev. of returns) for both stocks A and B, (iii) The correlation between returns on A and B. b) Construct the MVP using stocks A and B, which means that you calculate ... (i) The "weights" (fractions invested in A and B) of the MVP, (ii) The expected return and volatility of the MVP, c) Draw a sketch (qualitatively, given the information you have got so far), showing the two stocks A and B in the risk-return diagram, the frontier spanned by them, and the location of the market portfolio in relation to this
Step by Step Solution
There are 3 Steps involved in it

Get step-by-step solutions from verified subject matter experts