

Question: Problem 1: The table below shows the returns for two stocks and the NASDAQ market under two economic scenarios with corresponding probabilities. Using the data
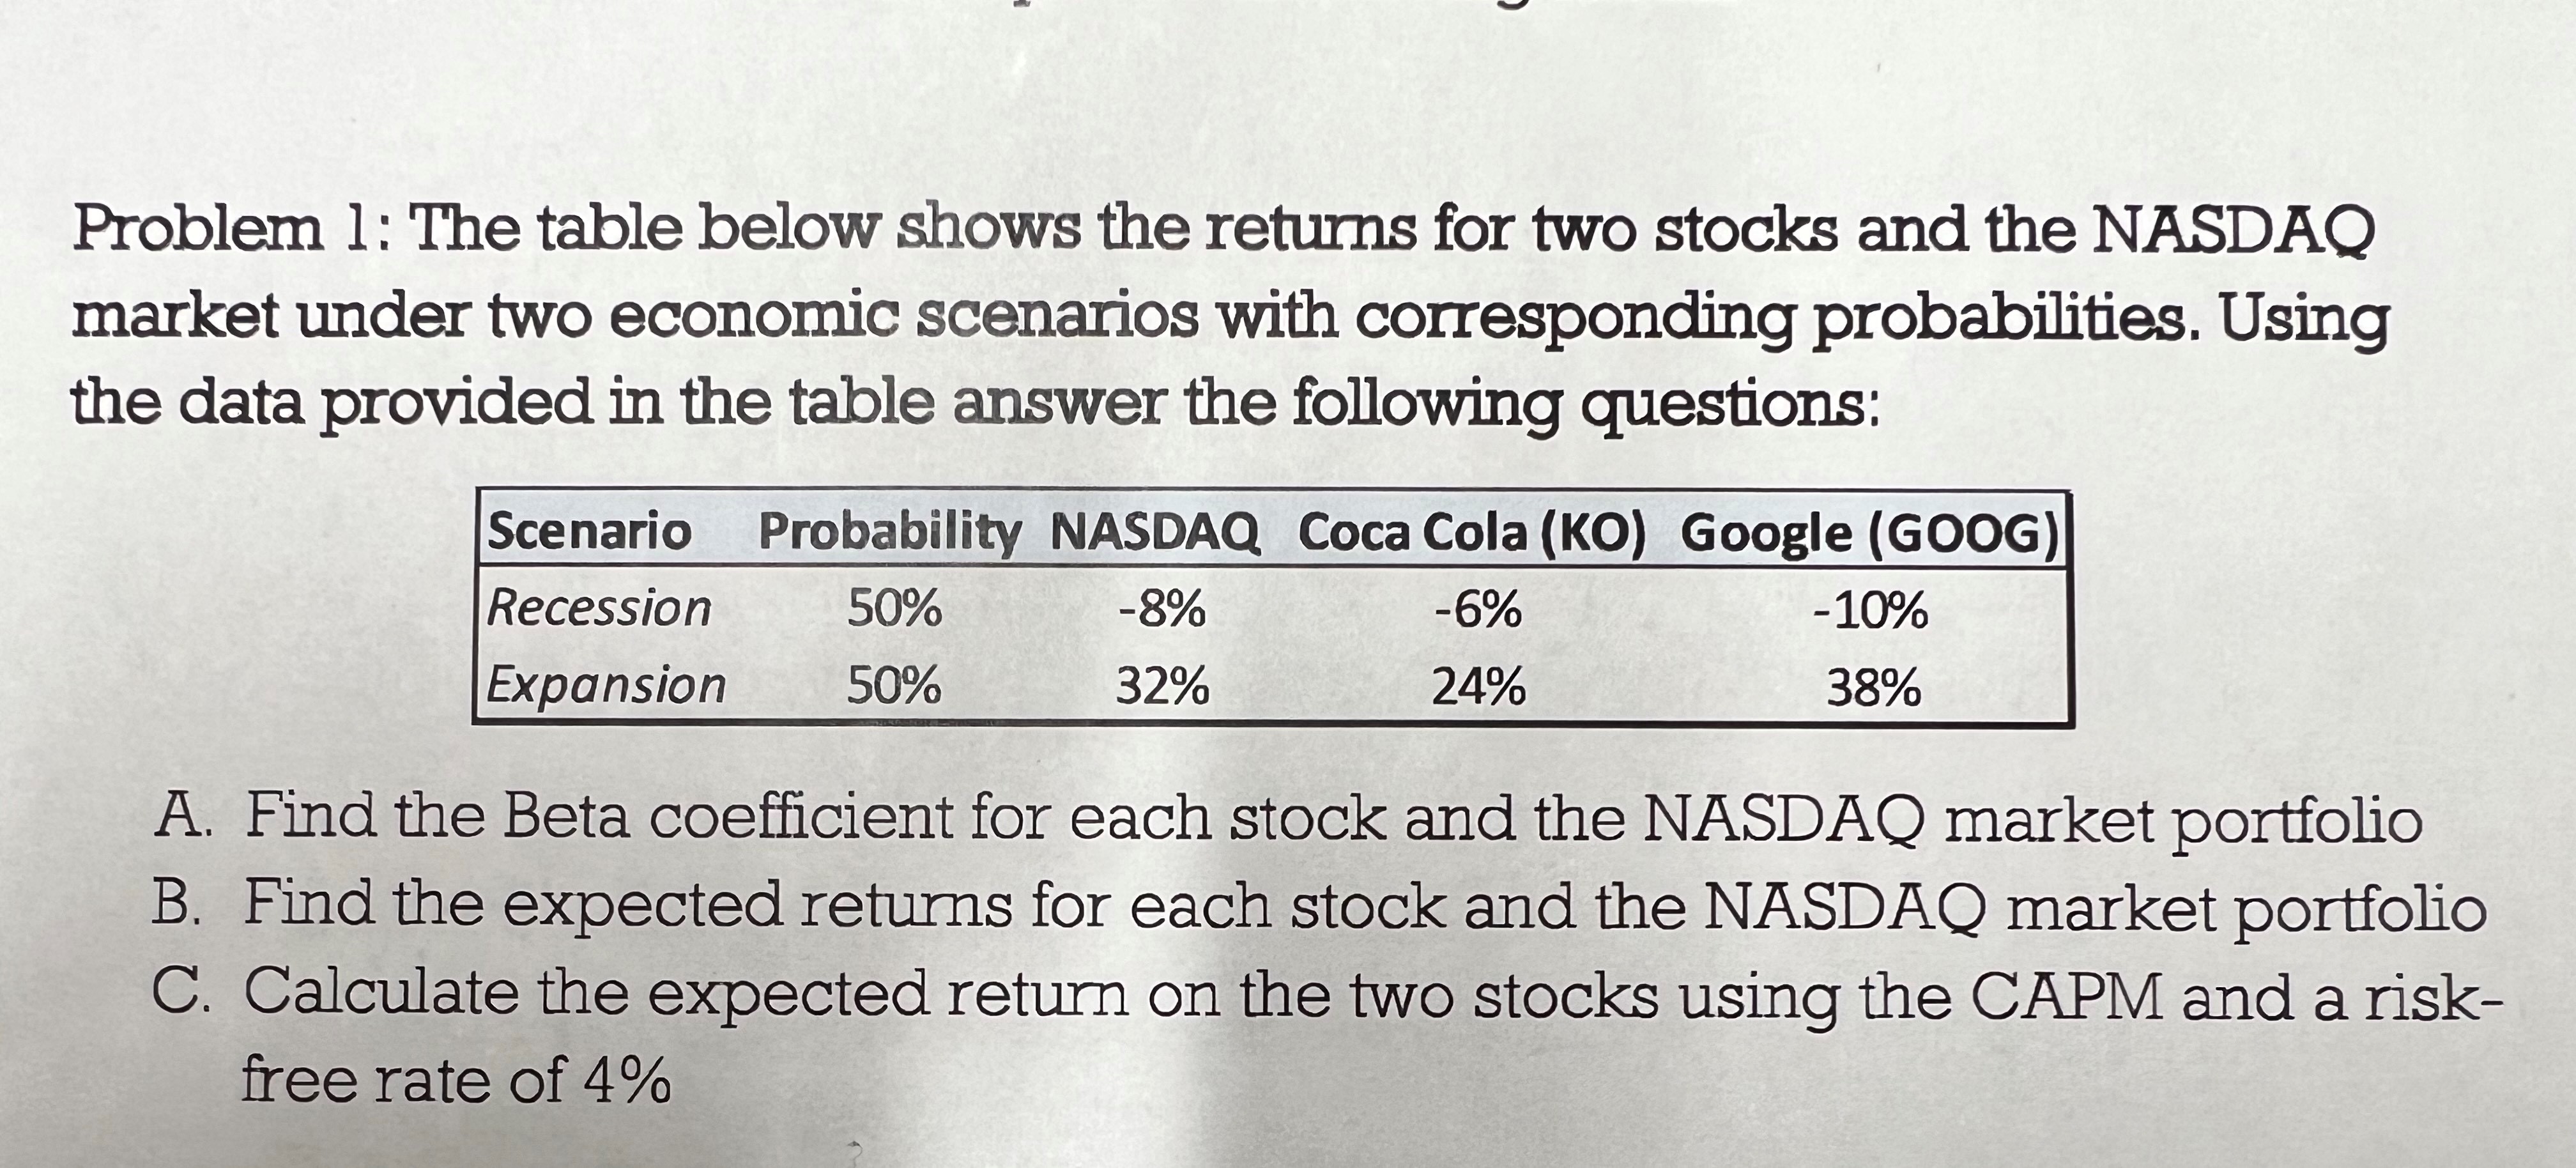
Problem 1: The table below shows the returns for two stocks and the NASDAQ market under two economic scenarios with corresponding probabilities. Using the data provided in the table answer the following questions: A. Find the Beta coefficient for each stock and the NASDAQ market portfolio B. Find the expected returns for each stock and the NASDAQ market portfolio C. Calculate the expected return on the two stocks using the CAPM and a riskfree rate of 4%
Step by Step Solution
There are 3 Steps involved in it
1 Expert Approved Answer
Step: 1 Unlock

Question Has Been Solved by an Expert!
Get step-by-step solutions from verified subject matter experts
Step: 2 Unlock
Step: 3 Unlock