

Question: Need some help with excel formatting. Correct answers are shown to the right of the bolded boxes. F G 1 J Portfolio Return IBM Return
Need some help with excel formatting. Correct answers are shown to the right of the bolded boxes.
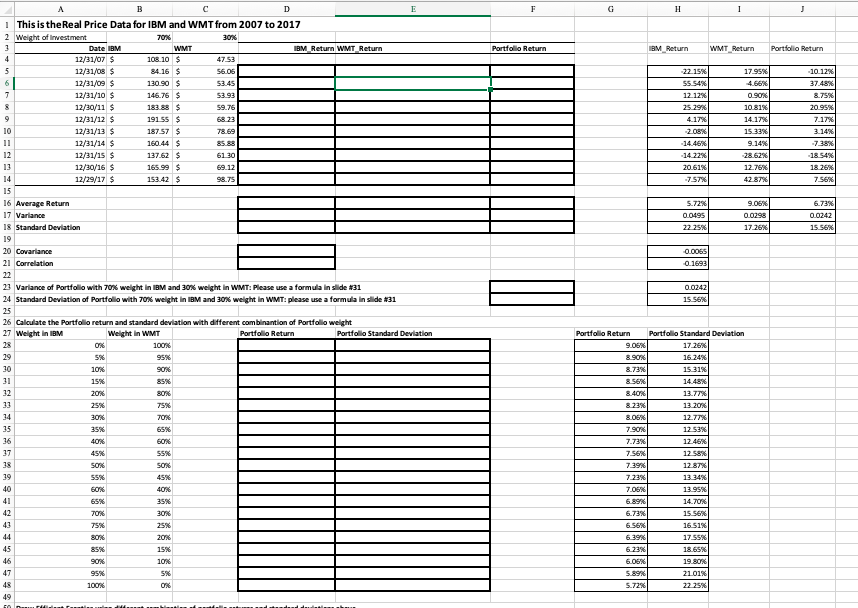
F G 1 J Portfolio Return IBM Return WMT Return Portfolio Return 17.95% 4.66 22.15% 55.54% 12 12% 25.29% 4.17% 0.90% 10.81% 14.17% 15.33% 9.14% 10.12% 37.48% 8.75% 20.95% 7.17% 3.14% -7.38% 18.54% 18.26% 7.56% 14.46% 14.22% 20.61% 12.76% 42 87% 5.72% 0.0495 9.06% 0.0298 17 26% 6.73% 0.0242 22 25% 15.50 A B D 1 This is the Real Price Data for IBM and WMT from 2007 to 2017 2 Weight of Investment 70% 30% 3 Date IBM WMT IBM Return WMT Return 4 12/31/07 $ 108.10 $ 4753 5 12/31/08 $ 84.16 $ 56.06 6 12/31/09 $ 130.90 $ 53.45 7 12/31/10 $ 146.76 $ 53.93 8 12/30/11 $ 183.88 $ 59.76 9 12/31/12 19155$ 68.23 10 12/31/13 $ 187.57 $ 78.69 11 12/31/14 $ 160.44 $ 85.88 12 12/31/15 $ 137.62 $ 61 30 13 12/30/16 $ 165.99 $ 69.12 14 12/29/17 153.42 $ 98.75 15 16 Average Return 17 Variance 18 Standard Deviation 19 20 Covariance 21 Correlation 22 23 Variance of Portfolio with 70% weight in IBM and 30% weight in WMT: Please use a formula in slide 131 24 Standard Deviation of Portfolio with 70% weight in IBM and 30% weight in WMT: please use a formula in slide 831 25 26 Calculate the Portfolio return and standard deviation with different combination of Portfolio weight 27 Weight in IBM Weight in WMT Portfolio Return Portfolio Standard Deviation 28 0% 100% 19 5% 95% 30 10% 90% 31 15% 85% 32 20% 80% 11 25% 75% 34 30% 70% 15 35% 65% 36 40% 60% 37 45% 55% 18 50% 50% 19 55% 45% 40 60% 40% 65% 35% 42 70% 43 75% 25% 00055 0.1693 0.0242 15.56% Portfolio Return Portfolio Standard Deviation 9.05% 1726 8.90% 16.24% 8.73% 15.31% 8.56% 14.48% 8.40% 13.77% 8.2396 13.20% 8.05% 12.77% 7.90% 12 53% 7.73% 12.46% 7.56% 12.58% 7.39% 12 87% 7.2396 13 34% 7.05% 13.95% 6.89% 14.70% 6.73% 15 56% 6.56% 16 51% 6.39% 17-55% 6.23% 18.65% 6.05% 19.80% 5.896 21.01% 5.72% 22 25% 44 80% 45 85% 90% 20% 15% 10% 5%6 46 47 95% 100% 48 49 F G 1 J Portfolio Return IBM Return WMT Return Portfolio Return 17.95% 4.66 22.15% 55.54% 12 12% 25.29% 4.17% 0.90% 10.81% 14.17% 15.33% 9.14% 10.12% 37.48% 8.75% 20.95% 7.17% 3.14% -7.38% 18.54% 18.26% 7.56% 14.46% 14.22% 20.61% 12.76% 42 87% 5.72% 0.0495 9.06% 0.0298 17 26% 6.73% 0.0242 22 25% 15.50 A B D 1 This is the Real Price Data for IBM and WMT from 2007 to 2017 2 Weight of Investment 70% 30% 3 Date IBM WMT IBM Return WMT Return 4 12/31/07 $ 108.10 $ 4753 5 12/31/08 $ 84.16 $ 56.06 6 12/31/09 $ 130.90 $ 53.45 7 12/31/10 $ 146.76 $ 53.93 8 12/30/11 $ 183.88 $ 59.76 9 12/31/12 19155$ 68.23 10 12/31/13 $ 187.57 $ 78.69 11 12/31/14 $ 160.44 $ 85.88 12 12/31/15 $ 137.62 $ 61 30 13 12/30/16 $ 165.99 $ 69.12 14 12/29/17 153.42 $ 98.75 15 16 Average Return 17 Variance 18 Standard Deviation 19 20 Covariance 21 Correlation 22 23 Variance of Portfolio with 70% weight in IBM and 30% weight in WMT: Please use a formula in slide 131 24 Standard Deviation of Portfolio with 70% weight in IBM and 30% weight in WMT: please use a formula in slide 831 25 26 Calculate the Portfolio return and standard deviation with different combination of Portfolio weight 27 Weight in IBM Weight in WMT Portfolio Return Portfolio Standard Deviation 28 0% 100% 19 5% 95% 30 10% 90% 31 15% 85% 32 20% 80% 11 25% 75% 34 30% 70% 15 35% 65% 36 40% 60% 37 45% 55% 18 50% 50% 19 55% 45% 40 60% 40% 65% 35% 42 70% 43 75% 25% 00055 0.1693 0.0242 15.56% Portfolio Return Portfolio Standard Deviation 9.05% 1726 8.90% 16.24% 8.73% 15.31% 8.56% 14.48% 8.40% 13.77% 8.2396 13.20% 8.05% 12.77% 7.90% 12 53% 7.73% 12.46% 7.56% 12.58% 7.39% 12 87% 7.2396 13 34% 7.05% 13.95% 6.89% 14.70% 6.73% 15 56% 6.56% 16 51% 6.39% 17-55% 6.23% 18.65% 6.05% 19.80% 5.896 21.01% 5.72% 22 25% 44 80% 45 85% 90% 20% 15% 10% 5%6 46 47 95% 100% 48 49
Step by Step Solution
There are 3 Steps involved in it

Get step-by-step solutions from verified subject matter experts