

Question: Need to create a histogram to compare the cost between 'Total System Costs' and 'Total Incentive Approved ' by Python. Require the histogram with title
 Need to create a histogram to compare the cost between 'Total System Costs' and 'Total Incentive Approved ' by Python. Require the histogram with title and labels
Start with
import matplotlib.pyplot as plt
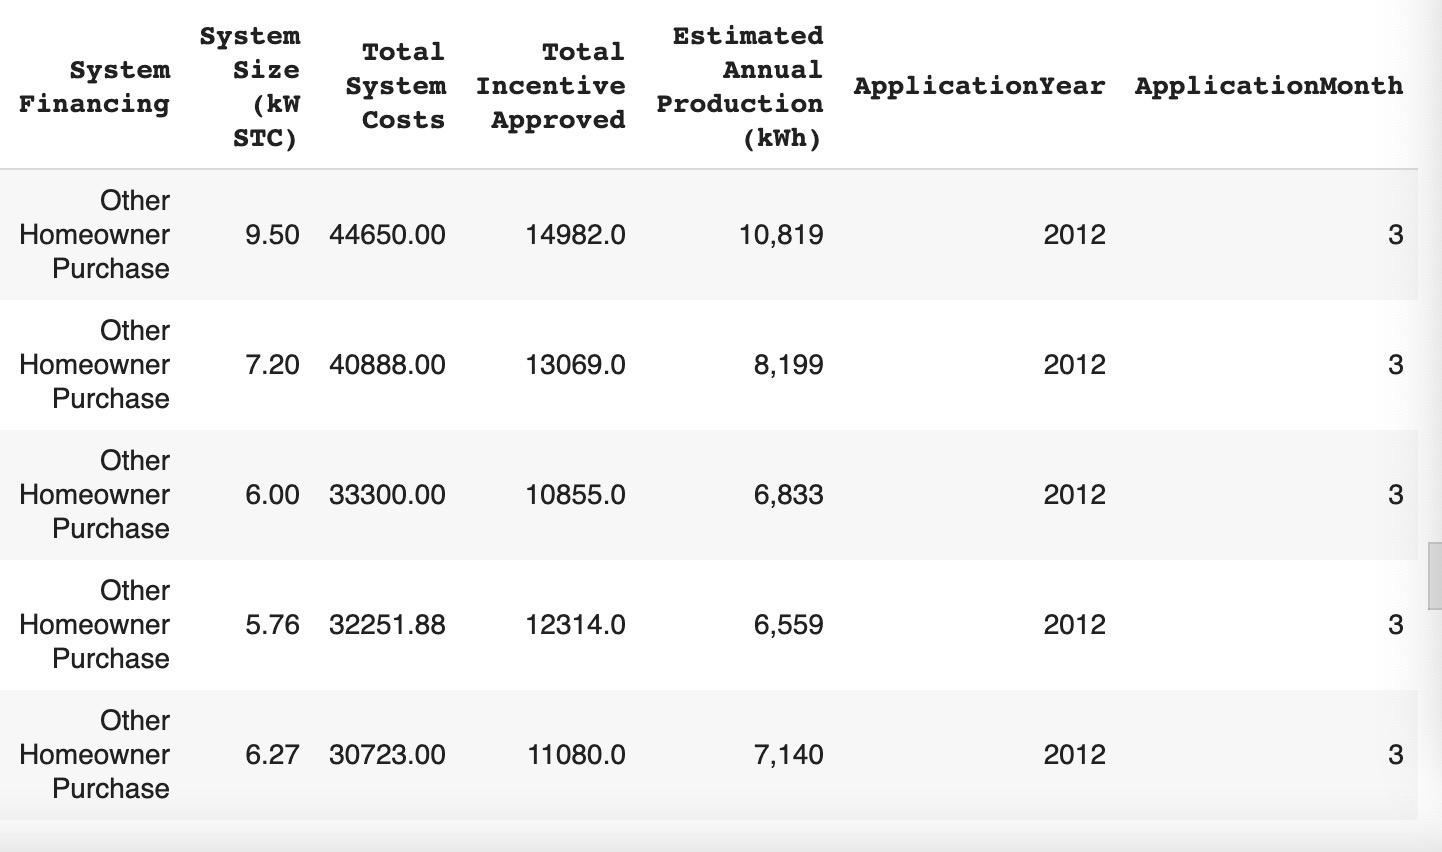
System Financing System Size (kW STC) Total Total System Incentive Costs Approved Estimated Annual Production (kWh) Application Year ApplicationMonth Other Homeowner Purchase 9.50 44650.00 14982.0 10,819 2012 3 Other Homeowner Purchase 7.20 40888.00 13069.0 8,199 2012 3 Other Homeowner Purchase 6.00 33300.00 10855.0 6,833 2012 3 Other Homeowner Purchase 5.76 32251.88 12314.0 6,559 2012 3 Other Homeowner Purchase 6.27 30723.00 11080.0 7,140 2012 3
Step by Step Solution
There are 3 Steps involved in it

Get step-by-step solutions from verified subject matter experts