

Question: Need to create a master script that runs my other 4 scripts. they make graphs and do interactive calculations so when I try it only
Need to create a master script that runs my other 4 scripts. they make graphs and do interactive calculations so when I try it only some scripts work as it runs them at the same time. need it to run each script in order and only run next script after other has finished. this is what I tried but does not work.
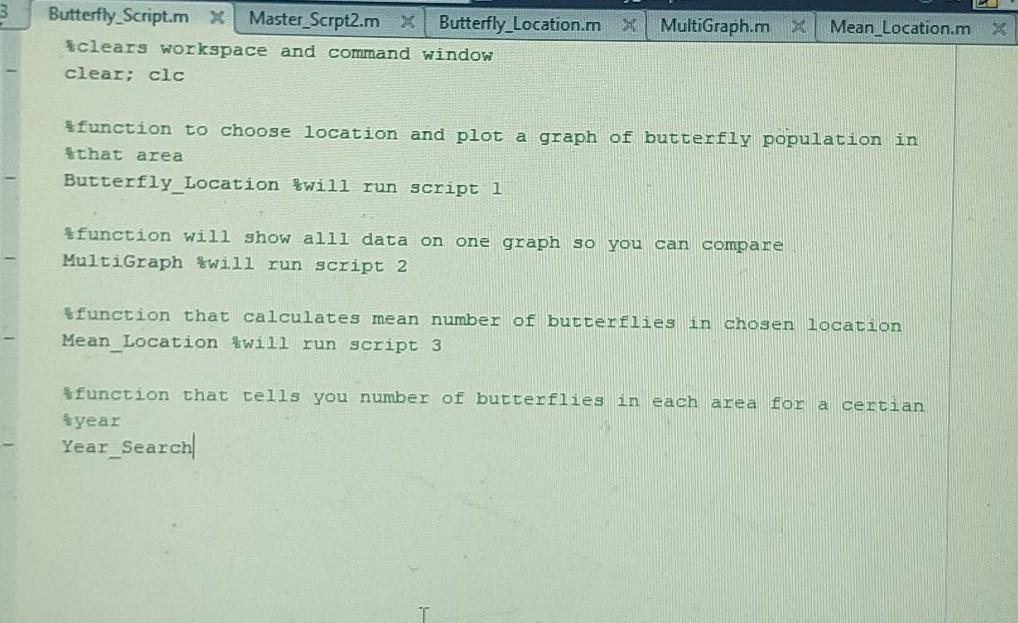
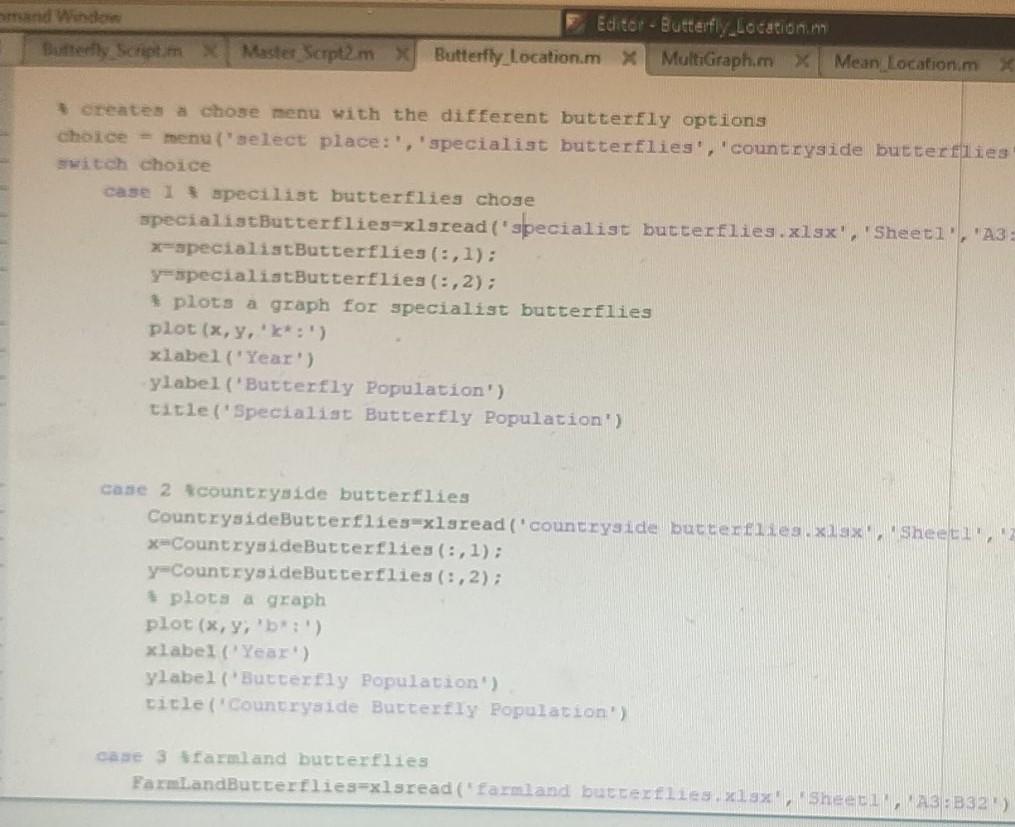
these are my 4 scripts
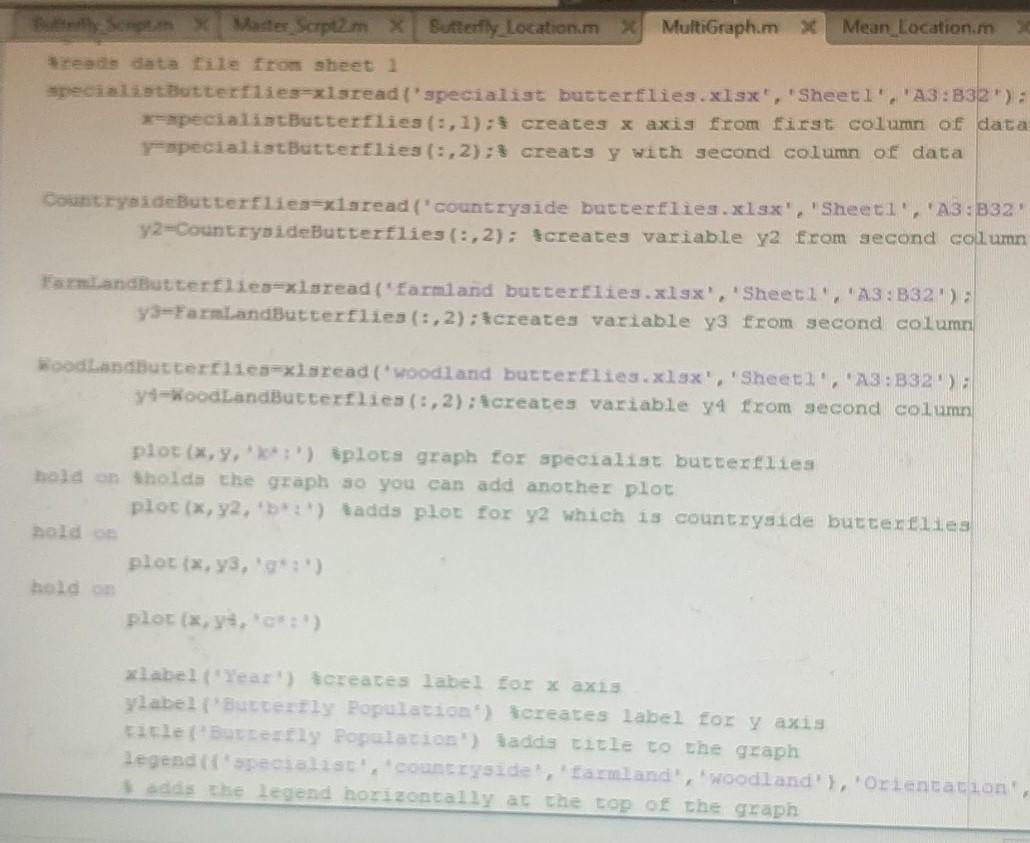
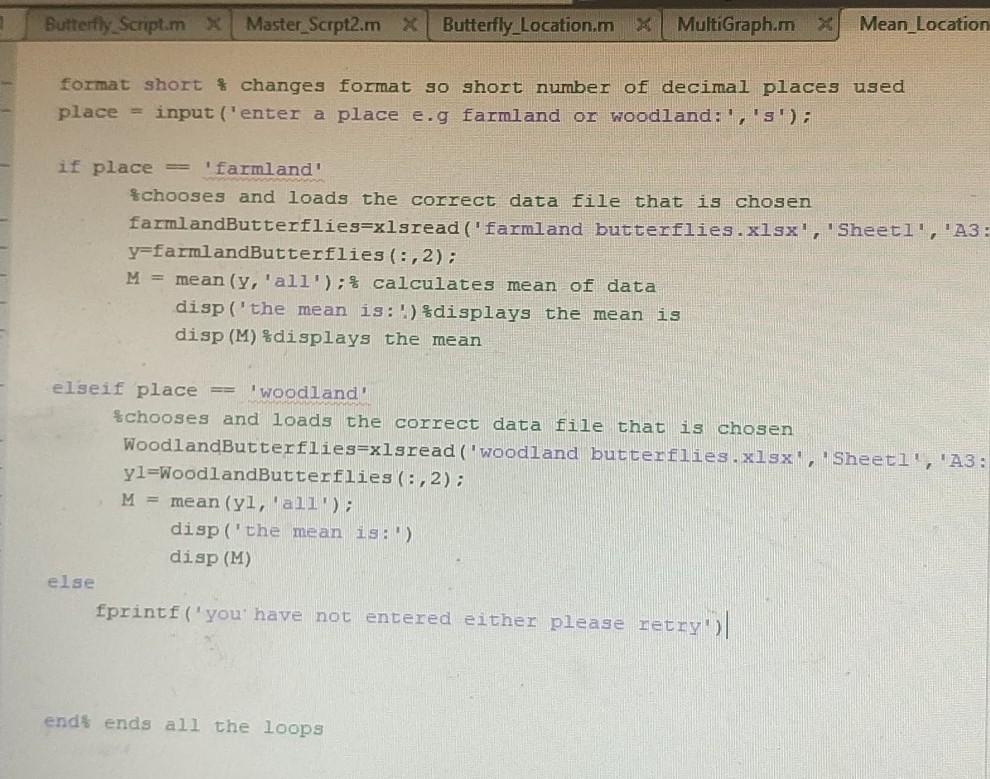
3 Mean Location.m Butterfly Script.mx Master_Scrpt2.m X Butterfly_Location.m X MultiGraph.mx Sclears workspace and command window clear; clc *function to choose location and plot a graph of butterfly population in that area Butterfly_Location bwill run script 1 function will show alll data on one graph so you can compare MultiGraph will run script 2 function that calculates mean number of butterflies in chosen location Mean_Location twill run script 3 function that tells you number of butterflies in each area for a certian year Year Search Butterfly Script Editor - Butterfly Location Butterfly Location.mx MultiGraph.mx Master Scrpt2mX Mean Location.m creates a chose menu with the different butterfly options choice = menu('select place:', 'specialist butterflies', 'countryside butterflies switch Choice case 1 specilist butterflies chose specialistButterflies xlsread('specialist butterflies.xlsx', 'Sheet1', 'A3 = x-specialistButterflies (:,1); y-specialistButterflies (:,2); plots a graph for specialist butterflies plot (x, y, '**:') xlabel('Year') ylabel ('Butterfly Population') title('Specialist Butterfly Population') case 2 countryside butterflies CountrysideButterflies-xlsread('countryside butterflies.x19x Sheeti', 'Z x-CountrysideButterflies (:,1); y-CountrysideButterflies (:, 2); plots a graph plot(X, Y, 'b*:') xlabel ('Year') ylabel (Butterfly Population) title('Countryside Butterfly Population) case 3 Starmland butterflies FarmlandButterflies=xlsread ('farmland butterflies xlsx Sheet MAS:B32) Screen Master Scipat2.m Butterfly Location. MultiGraphm X Mean_Location.m read data file from sheet 1 specialistBotterflies=isread 'specialist butterflies.xlsx', 'Sheetl', 'A3:832): EspecialistButterflies (:,1): creates x axis from first column of data specialistButterflies (:,2); $ creats y with second column of data CountrysideButterfliesszisread('countryside butterflies.xlsx", 'Sheet1', 'A3: B32" y2-countryside Butterflies (:,2); tcreates variable y2 from second column FarmlandButterflies=xlsxead ("Earmland butterflies.xlsx', 'Sheet1', 'A:B32) y=FarmlandButterflies (:,2): creates variable y3 from second columni WoodlandButterflies-xlsread (woodland butterflies.xlsx', 'Sheet1A3:332) y-WoodlandButterflies (:, 2): Acreates variable y4 from second column plot (x, y,') plots graph for specialist butterflies hold holds the graph so you can add another plot plot (x, y2,5*) fadds plot for y2 which is countryside butterflies plotix, y3,':') plot (x,y,c*:) label('Year') Screates label for X axis ylabel('Sutterfly Population) Screates label for y axis title Satterfly Popolation') Sadds title to the graph legend of specialist countryside', 'farmland", woodland' ), Orientation as the legend horizontally at the top of the graph 2 Butterfly Script.mx Master_Scrpt2.m X Butterfly_Location.m * MultiGraph.mx Mean Location format short changes format so short number of decimal places used place = input('enter a place e.g farmland or woodland:', 's'); if place == farmland Schooses and loads the correct data file that is chosen farmlandButterflies=xlsread('farmland butterflies.xlsx', 'Sheeti', 'A3: y=farmlandButterflies (:, 2); M = mean (y, 'all'); calculates mean of data disp('the mean is:') %displays the mean is disp (M) displays the mean elseif place woodland Schooses and loads the correct data file that is chosen WoodlandButterflies=xlsread('woodland butterflies.xlsx , Sheetl', 'A3: yl=WoodlandButterflies (:, 2); M = mean (yl, 'all'); disp('the mean is:') disp (M) else fprintf("you have not entered either please retry')|| endt ends all the loops 3 Mean Location.m Butterfly Script.mx Master_Scrpt2.m X Butterfly_Location.m X MultiGraph.mx Sclears workspace and command window clear; clc *function to choose location and plot a graph of butterfly population in that area Butterfly_Location bwill run script 1 function will show alll data on one graph so you can compare MultiGraph will run script 2 function that calculates mean number of butterflies in chosen location Mean_Location twill run script 3 function that tells you number of butterflies in each area for a certian year Year Search Butterfly Script Editor - Butterfly Location Butterfly Location.mx MultiGraph.mx Master Scrpt2mX Mean Location.m creates a chose menu with the different butterfly options choice = menu('select place:', 'specialist butterflies', 'countryside butterflies switch Choice case 1 specilist butterflies chose specialistButterflies xlsread('specialist butterflies.xlsx', 'Sheet1', 'A3 = x-specialistButterflies (:,1); y-specialistButterflies (:,2); plots a graph for specialist butterflies plot (x, y, '**:') xlabel('Year') ylabel ('Butterfly Population') title('Specialist Butterfly Population') case 2 countryside butterflies CountrysideButterflies-xlsread('countryside butterflies.x19x Sheeti', 'Z x-CountrysideButterflies (:,1); y-CountrysideButterflies (:, 2); plots a graph plot(X, Y, 'b*:') xlabel ('Year') ylabel (Butterfly Population) title('Countryside Butterfly Population) case 3 Starmland butterflies FarmlandButterflies=xlsread ('farmland butterflies xlsx Sheet MAS:B32) Screen Master Scipat2.m Butterfly Location. MultiGraphm X Mean_Location.m read data file from sheet 1 specialistBotterflies=isread 'specialist butterflies.xlsx', 'Sheetl', 'A3:832): EspecialistButterflies (:,1): creates x axis from first column of data specialistButterflies (:,2); $ creats y with second column of data CountrysideButterfliesszisread('countryside butterflies.xlsx", 'Sheet1', 'A3: B32" y2-countryside Butterflies (:,2); tcreates variable y2 from second column FarmlandButterflies=xlsxead ("Earmland butterflies.xlsx', 'Sheet1', 'A:B32) y=FarmlandButterflies (:,2): creates variable y3 from second columni WoodlandButterflies-xlsread (woodland butterflies.xlsx', 'Sheet1A3:332) y-WoodlandButterflies (:, 2): Acreates variable y4 from second column plot (x, y,') plots graph for specialist butterflies hold holds the graph so you can add another plot plot (x, y2,5*) fadds plot for y2 which is countryside butterflies plotix, y3,':') plot (x,y,c*:) label('Year') Screates label for X axis ylabel('Sutterfly Population) Screates label for y axis title Satterfly Popolation') Sadds title to the graph legend of specialist countryside', 'farmland", woodland' ), Orientation as the legend horizontally at the top of the graph 2 Butterfly Script.mx Master_Scrpt2.m X Butterfly_Location.m * MultiGraph.mx Mean Location format short changes format so short number of decimal places used place = input('enter a place e.g farmland or woodland:', 's'); if place == farmland Schooses and loads the correct data file that is chosen farmlandButterflies=xlsread('farmland butterflies.xlsx', 'Sheeti', 'A3: y=farmlandButterflies (:, 2); M = mean (y, 'all'); calculates mean of data disp('the mean is:') %displays the mean is disp (M) displays the mean elseif place woodland Schooses and loads the correct data file that is chosen WoodlandButterflies=xlsread('woodland butterflies.xlsx , Sheetl', 'A3: yl=WoodlandButterflies (:, 2); M = mean (yl, 'all'); disp('the mean is:') disp (M) else fprintf("you have not entered either please retry')|| endt ends all the loops
Step by Step Solution
There are 3 Steps involved in it

Get step-by-step solutions from verified subject matter experts