

Question: NEED TO CREATE EXCEL MODEL USING EXCEL SOLVER Scenario: The Hershiser/Bush Brewery recently signed an agreement to send its two wildly popular craft beers (Shutout
NEED TO CREATE EXCEL MODEL USING EXCEL SOLVER
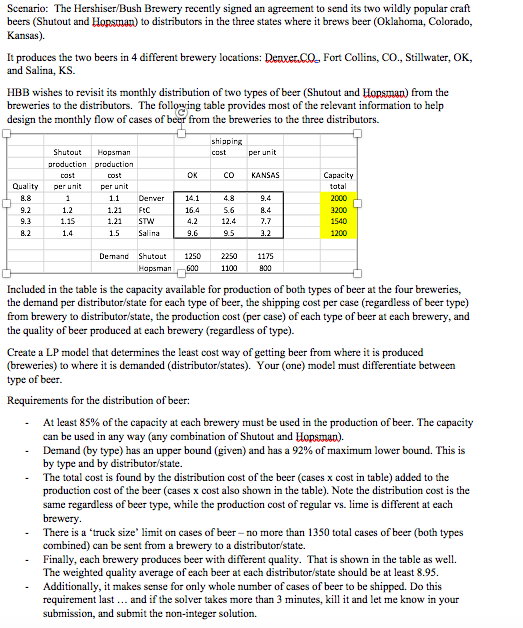
Scenario: The Hershiser/Bush Brewery recently signed an agreement to send its two wildly popular craft beers (Shutout and Hopstan) to distributors in the three states where it brews beer (Oklahoma, Colorado, Kansas). It produces the two beers in 4 different brewery locations: Deaver.Co. Fort Collins, Co., Stillwater, OK, and Salina, KS. HBB wishes to revisit its monthly distribution of two types of beer (Shutout and Hopsinan) from the breweries to the distributors. The following table provides most of the relevant information to help design the monthly flow of cases of beer from the breweries to the three distributors. shipping cost per unit OK CO KANSAS Quality Shutout Hopsman production production cast per unit per unit 1.1 Derver 1.2 1.21 FC 1.15 1.21 STW 1.4 1.5 Salina 9.4 Capacity total 2000 3200 1540 1200 14.1 16.4 4.2 9.6 9.2 9.3 8.2 5.6 12.4 9.5 7.7 Demand Shutout Hapsman 1250 600 2250 1100 1175 900 Included in the table is the capacity available for production of both types of beer at the four breweries, the demand per distributor/state for each type of beer, the shipping cost per case (regardless of beer type) from brewery to distributor/state, the production cost (per case) of each type of beer at each brewery, and the quality of beer produced at each brewery (regardless of type). Create a LP model that determines the least cost way of getting beer from where it is produced (breweries) to where it is demanded (distributor/states). Your (one) model must differentiate between type of beer. Requirements for the distribution of beer: At least 85% of the capacity at each brewery must be used in the production of beer. The capacity can be used in any way (any combination of Shutout and Hopsiran.). Demand (by type) has an upper bound (given) and has a 92% of maximum lower bound. This is by type and by distributor/state. The total cost is found by the distribution cost of the beer (cases x cost in table) added to the production cost of the beer (cases x cost also shown in the table). Note the distribution cost is the same regardless of beer type, while the production cost of regular vs. lime is different at each brewery There is a truck size" limit on cases of beer - no more than 1350 total cases of beer (both types combined) can be sent from a brewery to a distributor/state. Finally, each brewery produces beer with different quality. That is shown in the table as well. The weighted quality average of each beer at each distributor/state should be at least 8.95. Additionally, it makes sense for only whole number of cases of beer to be shipped. Do this requirement last ... and if the solver takes more than 3 minutes, kill it and let me know in your submission, and submit the non-integer solution. Scenario: The Hershiser/Bush Brewery recently signed an agreement to send its two wildly popular craft beers (Shutout and Hopstan) to distributors in the three states where it brews beer (Oklahoma, Colorado, Kansas). It produces the two beers in 4 different brewery locations: Deaver.Co. Fort Collins, Co., Stillwater, OK, and Salina, KS. HBB wishes to revisit its monthly distribution of two types of beer (Shutout and Hopsinan) from the breweries to the distributors. The following table provides most of the relevant information to help design the monthly flow of cases of beer from the breweries to the three distributors. shipping cost per unit OK CO KANSAS Quality Shutout Hopsman production production cast per unit per unit 1.1 Derver 1.2 1.21 FC 1.15 1.21 STW 1.4 1.5 Salina 9.4 Capacity total 2000 3200 1540 1200 14.1 16.4 4.2 9.6 9.2 9.3 8.2 5.6 12.4 9.5 7.7 Demand Shutout Hapsman 1250 600 2250 1100 1175 900 Included in the table is the capacity available for production of both types of beer at the four breweries, the demand per distributor/state for each type of beer, the shipping cost per case (regardless of beer type) from brewery to distributor/state, the production cost (per case) of each type of beer at each brewery, and the quality of beer produced at each brewery (regardless of type). Create a LP model that determines the least cost way of getting beer from where it is produced (breweries) to where it is demanded (distributor/states). Your (one) model must differentiate between type of beer. Requirements for the distribution of beer: At least 85% of the capacity at each brewery must be used in the production of beer. The capacity can be used in any way (any combination of Shutout and Hopsiran.). Demand (by type) has an upper bound (given) and has a 92% of maximum lower bound. This is by type and by distributor/state. The total cost is found by the distribution cost of the beer (cases x cost in table) added to the production cost of the beer (cases x cost also shown in the table). Note the distribution cost is the same regardless of beer type, while the production cost of regular vs. lime is different at each brewery There is a truck size" limit on cases of beer - no more than 1350 total cases of beer (both types combined) can be sent from a brewery to a distributor/state. Finally, each brewery produces beer with different quality. That is shown in the table as well. The weighted quality average of each beer at each distributor/state should be at least 8.95. Additionally, it makes sense for only whole number of cases of beer to be shipped. Do this requirement last ... and if the solver takes more than 3 minutes, kill it and let me know in your submission, and submit the non-integer solutionStep by Step Solution
There are 3 Steps involved in it
1 Expert Approved Answer
Step: 1 Unlock

Question Has Been Solved by an Expert!
Get step-by-step solutions from verified subject matter experts
Step: 2 Unlock
Step: 3 Unlock