

Question: need to know coordinate points for graph.. You've decided to take it upon yourself to complete an operating break-eve information in the table to complete
need to know coordinate points for graph.. 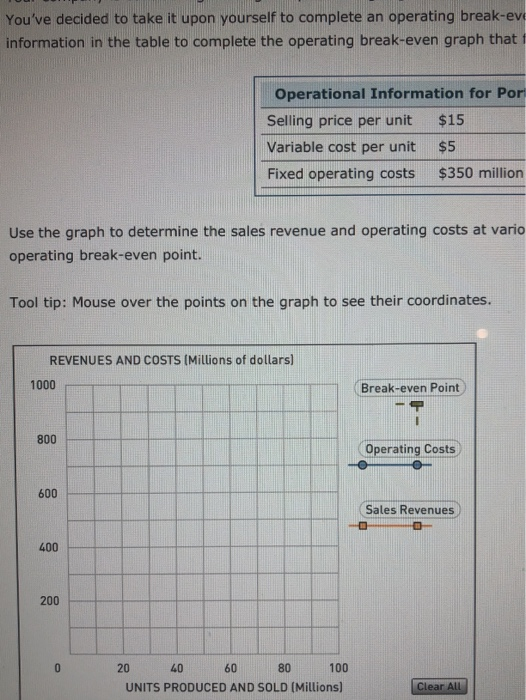
You've decided to take it upon yourself to complete an operating break-eve information in the table to complete the operating break-even graph that Operational Information for Por Selling price per unit $15 Variable cost per unit $5 Fixed operating costs $350 million Use the graph to determine the sales revenue and operating costs at vario operating break-even point. Tool tip: Mouse over the points on the graph to see their coordinates. REVENUES AND COSTS (Millions of dollars) 1000 Break-even Point Operating Costs Sales Revenues 0 20 40 60 80 100 UNITS PRODUCED AND SOLD (Millions) Clear All
Step by Step Solution
There are 3 Steps involved in it
1 Expert Approved Answer
Step: 1 Unlock

Question Has Been Solved by an Expert!
Get step-by-step solutions from verified subject matter experts
Step: 2 Unlock
Step: 3 Unlock