

Question: 3. Operating break-even graph analysis When does a firm achieve it's operating break-even point? Your company is considering altering its operations going forward but is
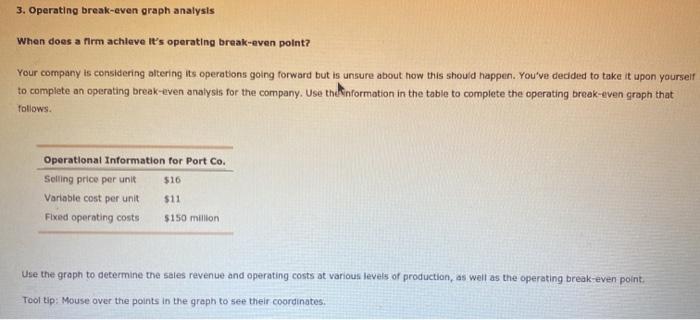
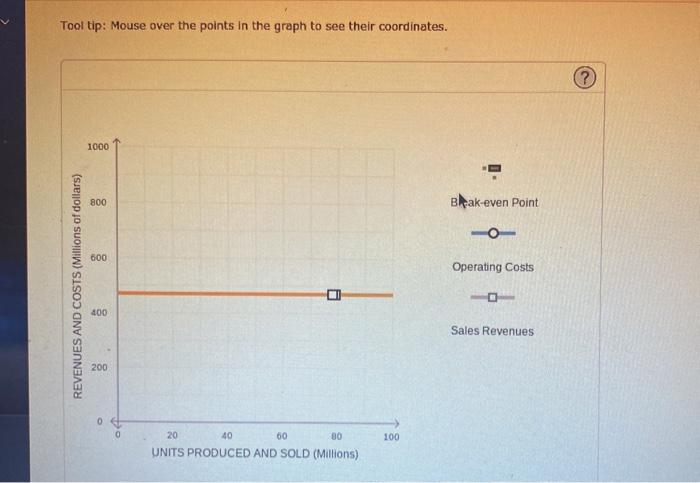
3. Operating break-even graph analysis When does a firm achieve it's operating break-even point? Your company is considering altering its operations going forward but is unsure about how this should happen. You've decided to take it upon yourself to complete an operating break-even analysis for the company. Use the information in the table to complete the operating break-even graph that follows. Operational Information for Port Co. Selling price per unit $16 Variable cost per unit $11 Fixed operating costs $150 million Use the graph to determine the sales revenue and operating costs at various levels of production, as well as the operating break-even point Tooltip: Mouse over the points in the graph to see their coordinates. Tooltip: Mouse over the points in the graph to see their coordinates. 1000 800 Bleak-even Point 600 Operating Costs REVENUES AND COSTS (Millions of dollars) 400 Sales Revenues 200 0 0 100 20 40 60 30 UNITS PRODUCED AND SOLD (Millions)
Step by Step Solution
There are 3 Steps involved in it

Get step-by-step solutions from verified subject matter experts