

Question: Need to recreate the graph shown using MATLAB I have the titling and labeling of the graph already just having trouble figuring out how to
Need to recreate the graph shown using MATLAB
I have the titling and labeling of the graph already just having trouble figuring out how to set up the loop but I know it's something kind of like this for t = 0:45 x = y = xVel = yVel = if yPos
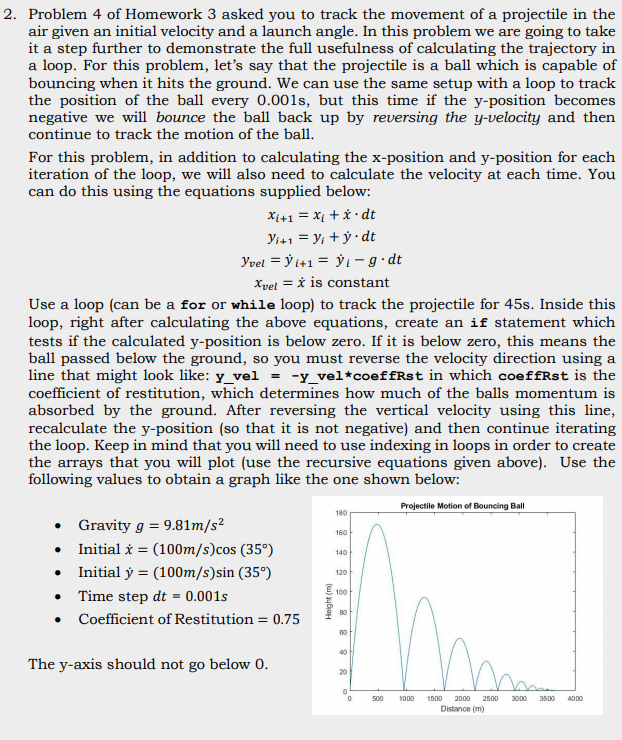
2. Problem 4 of Homework 3 asked you to track the movement of a projectile in the air given an initial velocity and a launch angle. In this problem we are going to take it a step further to demonstrate the full usefulness of calculating the trajectory in a loop. For this problem, let's say that the projectile is a ball which is capable of bouncing when it hits the ground. We can use the same setup with a loop to track the position of the ball every 0.001s, but this time if the y-position becomes negative we will bounce the ball back up by reversing the y-velocity and then continue to track the motion of the ball. For this problem, in addition to calculating the x-position and y-position for each iteration of the loop, we will also need to calculate the velocity at each time. You can do this using the equations supplied below: Xi+1 = x + *dt yi+1 = y +: dt yvel = $i+1= $i-gdt Xvel = * is constant Use a loop (can be a for or while loop) to track the projectile for 45s. Inside this loop, right after calculating the above equations, create an if statement which tests if the calculated y-position is below zero. If it is below zero, this means the ball passed below the ground, so you must reverse the velocity direction using a line that might look like: y vel = -y vel*coeffRst in which coeffRst is the coefficient of restitution, which determines how much of the balls momentum is absorbed by the ground. After reversing the vertical velocity using this line, recalculate the y-position (so that it is not negative) and then continue iterating the loop. Keep in mind that you will need to use indexing in loops in order to create the arrays that you will plot (use the recursive equations given above). Use the following values to obtain a graph like the one shown below: Projectile Motion of Bouncing Ball Gravity g = 9.81m/s2 Initial i = (100m/s)cos (35) Initial y = (100m/s)sin (35) Time step dt = 0.001s Coefficient of Restitution = 0.75 Height (m) The y-axis should not go below 0. 0 500 1000 3000 3500 4000 1500 2000 2500 Distance (m) 2. Problem 4 of Homework 3 asked you to track the movement of a projectile in the air given an initial velocity and a launch angle. In this problem we are going to take it a step further to demonstrate the full usefulness of calculating the trajectory in a loop. For this problem, let's say that the projectile is a ball which is capable of bouncing when it hits the ground. We can use the same setup with a loop to track the position of the ball every 0.001s, but this time if the y-position becomes negative we will bounce the ball back up by reversing the y-velocity and then continue to track the motion of the ball. For this problem, in addition to calculating the x-position and y-position for each iteration of the loop, we will also need to calculate the velocity at each time. You can do this using the equations supplied below: Xi+1 = x + *dt yi+1 = y +: dt yvel = $i+1= $i-gdt Xvel = * is constant Use a loop (can be a for or while loop) to track the projectile for 45s. Inside this loop, right after calculating the above equations, create an if statement which tests if the calculated y-position is below zero. If it is below zero, this means the ball passed below the ground, so you must reverse the velocity direction using a line that might look like: y vel = -y vel*coeffRst in which coeffRst is the coefficient of restitution, which determines how much of the balls momentum is absorbed by the ground. After reversing the vertical velocity using this line, recalculate the y-position (so that it is not negative) and then continue iterating the loop. Keep in mind that you will need to use indexing in loops in order to create the arrays that you will plot (use the recursive equations given above). Use the following values to obtain a graph like the one shown below: Projectile Motion of Bouncing Ball Gravity g = 9.81m/s2 Initial i = (100m/s)cos (35) Initial y = (100m/s)sin (35) Time step dt = 0.001s Coefficient of Restitution = 0.75 Height (m) The y-axis should not go below 0. 0 500 1000 3000 3500 4000 1500 2000 2500 Distance (m)
Step by Step Solution
There are 3 Steps involved in it

Get step-by-step solutions from verified subject matter experts