

Question: Objective is to basically recreate the graph shown using MATLAB. Here's my code I have right now, I'm having trouble figuring out what to put
Objective is to basically recreate the graph shown using MATLAB. Here's my code I have right now, I'm having trouble figuring out what to put in the while loop and if statements.
F = 10; %force in Newtons tau = 100000000; %tau in Pascals J(1) = 0; T = 0; r = 0;
while r
hold on plot(rInvld,tauInvld,'r--') %plots shear stress for invalid radius plot(0:1,100000000,'g-') %plots maximum torsional shear stress plot(rVld,tauVld,'k-') %plots shear stress for valid radius hold off title('Torsional Shear Stress vs. Metal Rod Radius') xlabel('r(m)'), ylabel('tau(Pa)') xlim([0,.005]), ylim([0,500000000])
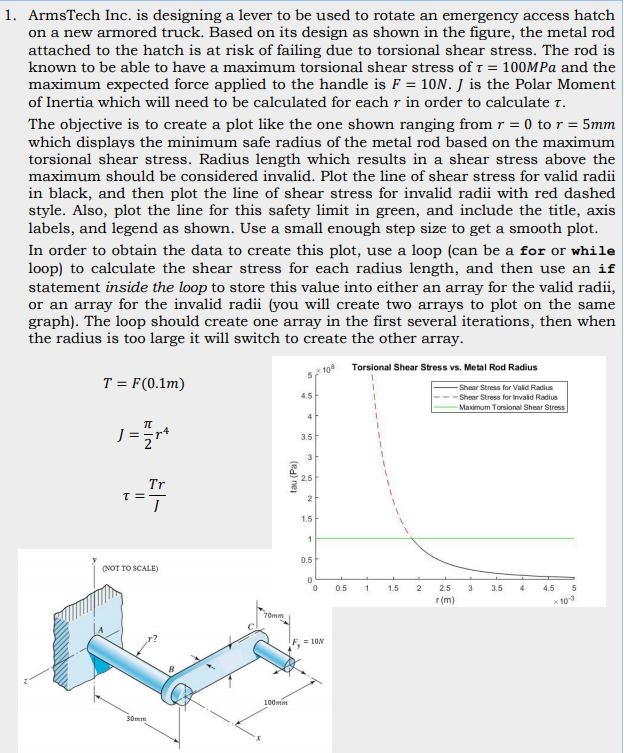
1. ArmsTech Inc. is designing a lever to be used to rotate an emergency access hatch on a new armored truck. Based on its design as shown in the figure, the metal rod attached to the hatch is at risk of failing due to torsional shear stress. The rod is known to be able to have a maximum torsional shear stress of t = 100MPa and the maximum expected force applied to the handle is F = 10N. J is the Polar Moment of Inertia which will need to be calculated for each r in order to calculate t. The objective is to create a plot like the one shown ranging from r=0 to r = 5mm which displays the minimum safe radius of the metal rod based on the maximum torsional shear stress. Radius length which results in a shear stress above the maximum should be considered invalid. Plot the line of shear stress for valid radii in black, and then plot the line of shear stress for invalid radii with red dashed style. Also, plot the line for this safety limit in green, and include the title, axis labels, and legend as shown. Use a small enough step size to get a smooth plot. In order to obtain the data to create this plot, use a loop (can be a for or while loop) to calculate the shear stress for each radius length, and then use an if statement inside the loop to store this value into either an array for the valid radii, or an array for the invalid radii (you will create two arrays to plot on the same graph). The loop should create one array in the first several iterations, then when the radius is too large it will switch to create the other array. 108 Torsional Shear Stress vs. Metal Rod Radius T = F(0.1m) -Shear Stress for Valid Radius Shear Stress for Invalid Radius Maximum Torsions Shear Stress Ein tau (Pa) Al (NOT TO SCALE) 0.5 1 1.5 2 3 3.5 4 2.5 (m) 4.5 5 x 10
Step by Step Solution
There are 3 Steps involved in it

Get step-by-step solutions from verified subject matter experts