

Question: Need to solve this problem c and d. Also, to compute slowdown as a ration relative to native execution. IN ADDITION: What is the geometric
Need to solve this problem c and d. Also, to compute slowdown as a ration relative to native execution.
IN ADDITION: What is the geometric mean of the pure and para virtualization ratios?
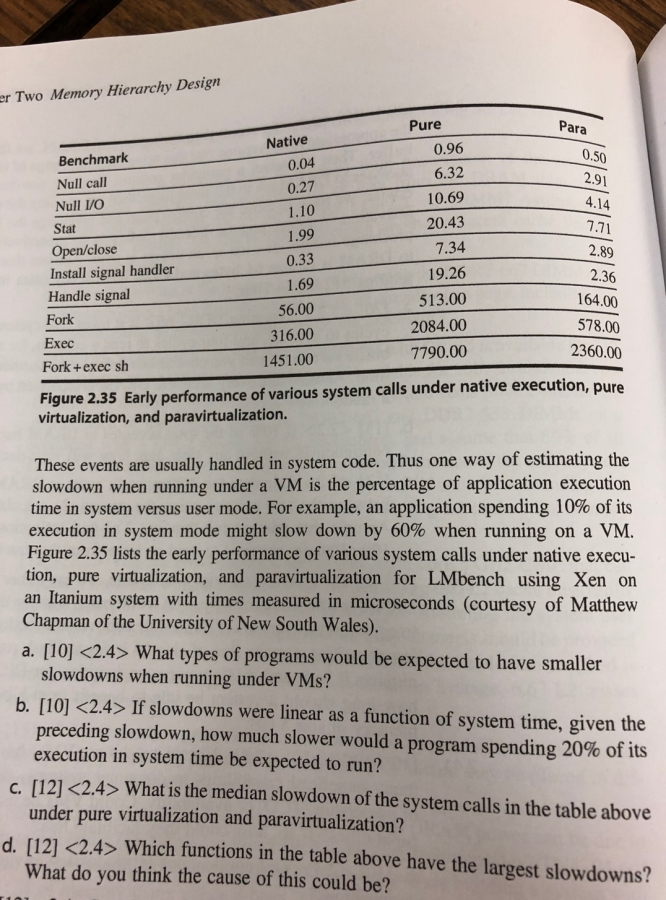
r Two Memory Hierarchy Design Pure Para Native Benchmark Null call Null VO Stat Open/close Install signal handler 0.04 0.27 1.10 1.99 0.33 1.69 56.00 316.00 1451.00 0.96 6.32 10.69 20.43 7.34 19.26 513.00 2084.00 7790.00 0.50 2.91 4.14 1.71 2.89 2.36 164.00 578.00 2360.00 Handle signal Fork Exec Fork+exec sh Figure 2.35 Early performance of various system calls under native execution, pure virtualization, and paravirtualization. These events are usually handled in system code. Thus one way of estimating the slowdown when running under a VM is the percentage of application execution time in system versus user mode. For example, an application spending 10% of its execution in system mode might slow down by 60% when running on a VM. Figure 2.35 lists the early performance of various system calls under native execu- tion, pure virtualization, and paravirtualization for LMbench using Xen on an Itanium system with times measured in microseconds (courtesy of Mathew Chapman of the University of New South Wales). a. [10 What types of programs would be expected to have smaller slowdowns when running under VMs? b. [10] 2.4> If slowdowns were linear as a function of system time, given the receding slowdown, how much slower would a program spending 20% of its execution in system time be expected to run? under pure virtualization and paravirtualization? What do you think the cause of this could be? c. [12] What is the median slowdown of the system calls in the table above d. [121 2.4> Which functions in the table above have the largest slowdowns? r Two Memory Hierarchy Design Pure Para Native Benchmark Null call Null VO Stat Open/close Install signal handler 0.04 0.27 1.10 1.99 0.33 1.69 56.00 316.00 1451.00 0.96 6.32 10.69 20.43 7.34 19.26 513.00 2084.00 7790.00 0.50 2.91 4.14 1.71 2.89 2.36 164.00 578.00 2360.00 Handle signal Fork Exec Fork+exec sh Figure 2.35 Early performance of various system calls under native execution, pure virtualization, and paravirtualization. These events are usually handled in system code. Thus one way of estimating the slowdown when running under a VM is the percentage of application execution time in system versus user mode. For example, an application spending 10% of its execution in system mode might slow down by 60% when running on a VM. Figure 2.35 lists the early performance of various system calls under native execu- tion, pure virtualization, and paravirtualization for LMbench using Xen on an Itanium system with times measured in microseconds (courtesy of Mathew Chapman of the University of New South Wales). a. [10 What types of programs would be expected to have smaller slowdowns when running under VMs? b. [10] 2.4> If slowdowns were linear as a function of system time, given the receding slowdown, how much slower would a program spending 20% of its execution in system time be expected to run? under pure virtualization and paravirtualization? What do you think the cause of this could be? c. [12] What is the median slowdown of the system calls in the table above d. [121 2.4> Which functions in the table above have the largest slowdowns
Step by Step Solution
There are 3 Steps involved in it

Get step-by-step solutions from verified subject matter experts