

Question: needed graph and curve and explanation please do it urgent needed Practical Exercise 3- BUFFERS, pH MEASUREMENT AND AMINO ACID TITRATION Results Sheet Exercise 3.1.
 needed graph and curve and explanation please do it urgent needed
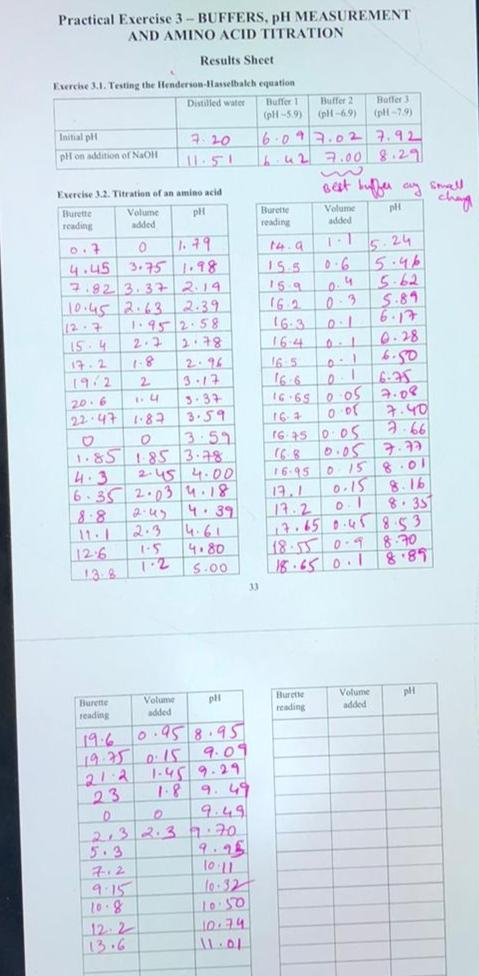
Practical Exercise 3- BUFFERS, pH MEASUREMENT AND AMINO ACID TITRATION Results Sheet Exercise 3.1. Testing the Henderson-Hasselbalch equation Distilled water Buffer 1 Buffer 2 Baffer 3 (pH-5.9) (pH-6.9) (pH-7.9) Initial pH 7:20 6.09 7.02 7.92 pH on addition of NaOH 6.42 7.00 8.29 Exercise 3.2. Titration of an amino acid Burette Volume pH Burette reading added reading 0.7 0 1.79 4.45 3.75 1.98 7.82 3.37 2.19 10.45 2.63. 2.39 12-7 1.95 2.58 15-4 2.2 2.78 17.2 1-8 2.96 19/2 2 3.17 20.6 1.4 3.37 22.47 1-87 3.59 0 3.59 1.85 1.85 3.78 4.3 2.45 4.00 6.35 2.03 4.18 2.45 4.39 11-1 2.3 4.61 12.6 1-5 4.80 1.2 pli Burette reading Volume added 19.6 0.95 8.95 19.75 0.15 9.09 21:2 1.45 9.29 23 1.8 D O 9.49 2.3 2.3 77.70 9.25 7.2 10:11 9.15 10.32 10.8 10:50 12 2 10.74 13.6 11.01 138 5.00 E 33 14. a 155 159 16.2 + Best buffer ay sowell Volume pH added 7-1 5.24 0.6 5.46 0.4 5-62 0-3 5.89 6.17 0.28 6.50 16-3 164 16 5 16.65 0.05 16-4 0:01 16:45 0.05 7.77 16.95 0 15 8.01 13.1 0.15 8.16 17.2 0.1 8.35 17.65 0.45 853 8.70 18.55 0.9 18.65 0.1 8.89 Burette Volume added pH reading 6-75 7.08 7.40 2-66 chay
Step by Step Solution
There are 3 Steps involved in it

Get step-by-step solutions from verified subject matter experts