

Question: Needing help to solve and understand problem 7. Please show work and steps, I am struggling to understand. 7. The table below shows the frequencies
Needing help to solve and understand problem 7. Please show work and steps, I am struggling to understand.
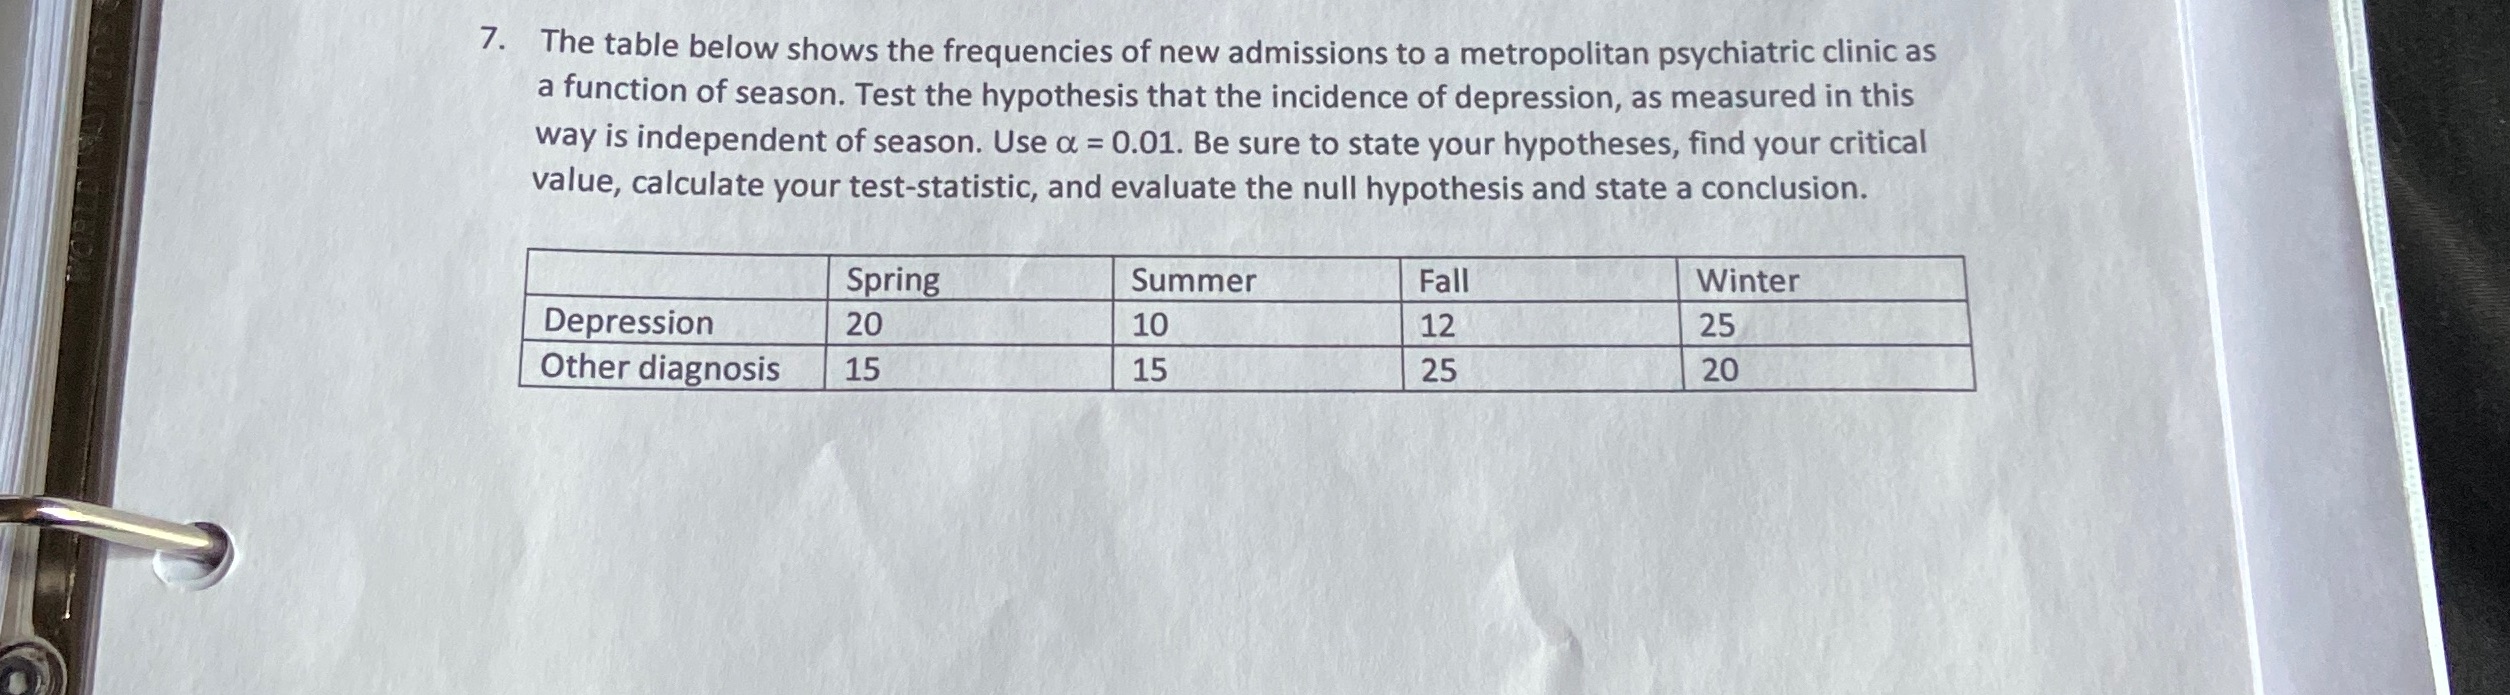
7. The table below shows the frequencies of new admissions to a metropolitan psychiatric clinic as a function of season. Test the hypothesis that the incidence of depression, as measured in this way is independent of season. Use a = 0.01. Be sure to state your hypotheses, find your critical value, calculate your test-statistic, and evaluate the null hypothesis and state a conclusion. Spring Summer Fall Winter Depression 20 10 12 25 Other diagnosis 15 15 25 20
Step by Step Solution
There are 3 Steps involved in it
1 Expert Approved Answer
Step: 1 Unlock

Question Has Been Solved by an Expert!
Get step-by-step solutions from verified subject matter experts
Step: 2 Unlock
Step: 3 Unlock