

Question: Needing help with pivot tables, the raw data is below: Data Tables - Student Office Warehouse Inc. currently makes four products. The Sales Director has
Needing help with pivot tables, the raw data is below:
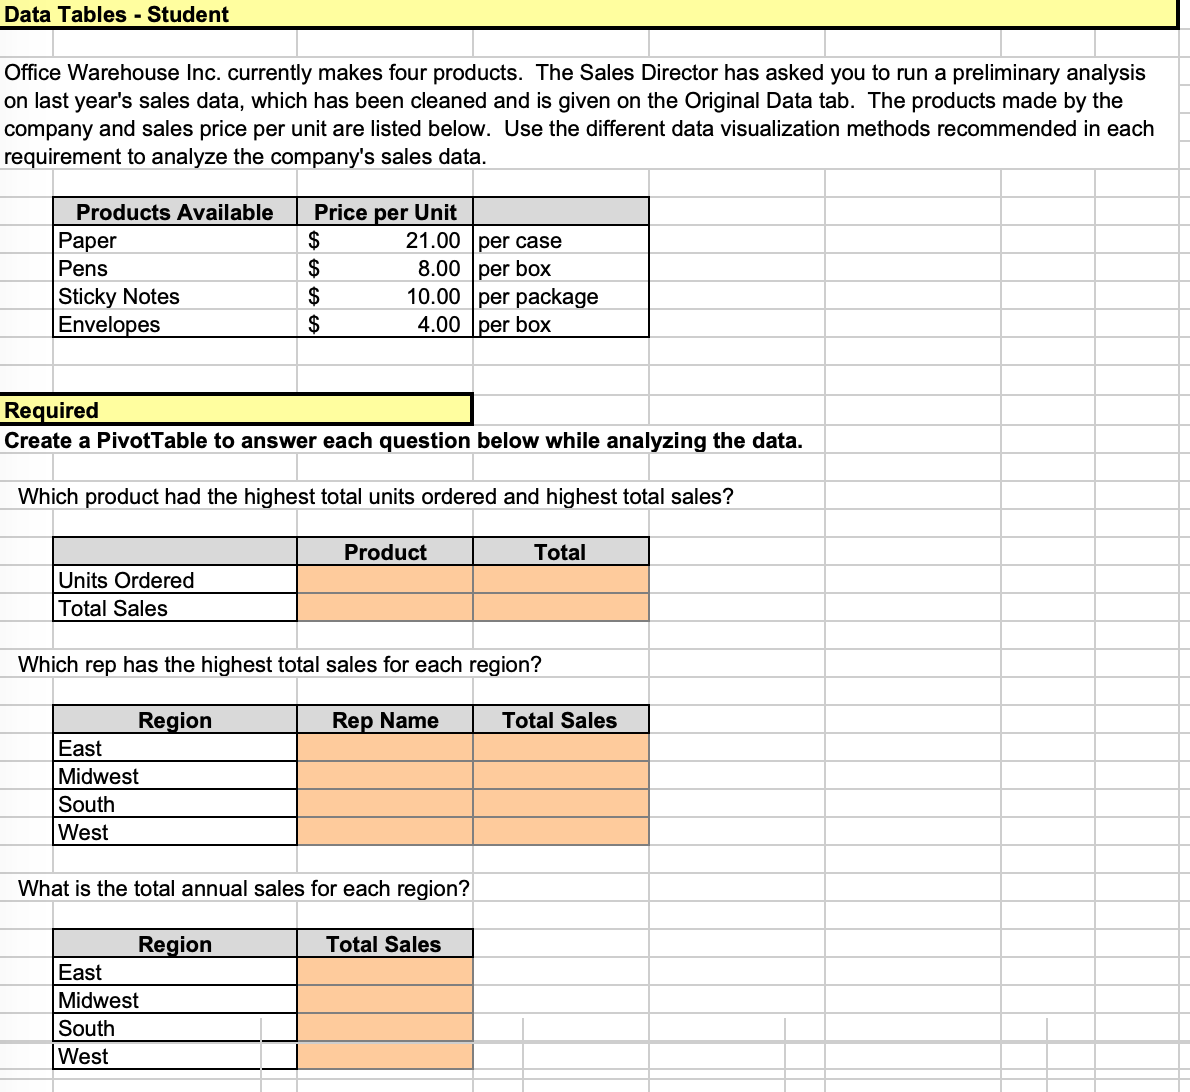
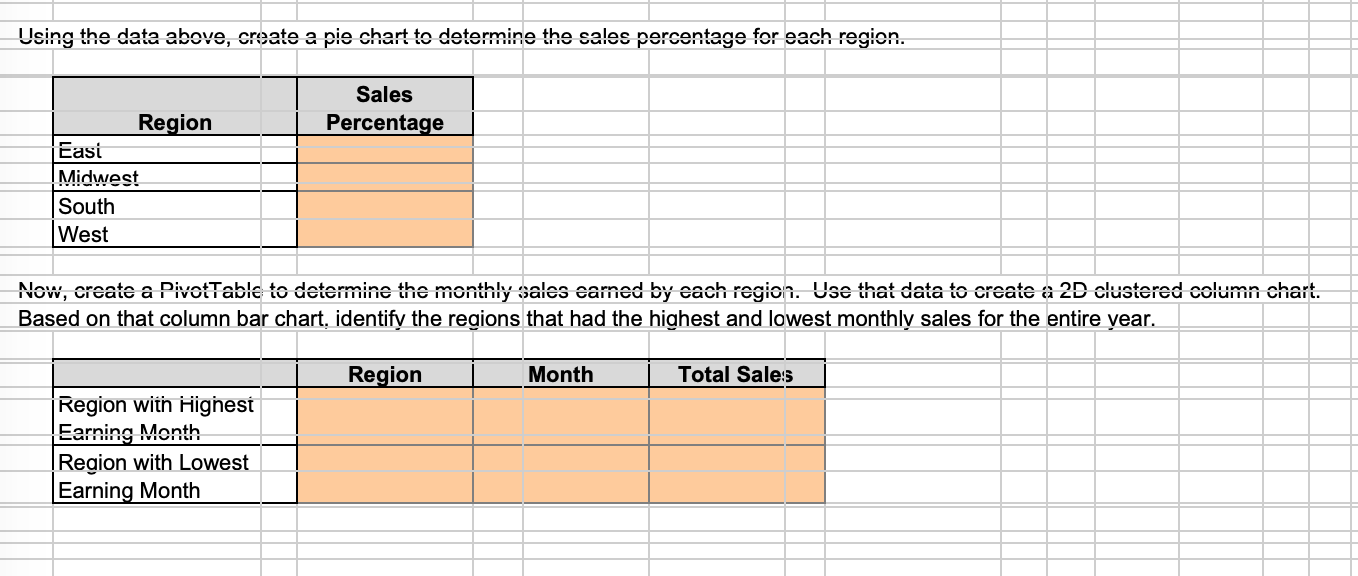

Data Tables - Student Office Warehouse Inc. currently makes four products. The Sales Director has asked you to run a preliminary analysis on last year's sales data, which has been cleaned and is given on the Original Data tab. The products made by the company and sales price per unit are listed below. Use the different data visualization methods recommended in each requirement to analyze the company's sales data. Products Available Price per Unit Paper 21.00 per case Pens 8.00 per box Sticky Notes 10.00 per package Envelopes 4.00 per box Required Create a PivotTable to answer each question below while analyzing the data. Which product had the highest total units ordered and highest total sales? Product Total Units Ordered Total Sales Which rep has the highest total sales for each region? Region Rep Name Total Sales East Midwest South West What is the total annual sales for each region? Region Total Sales East Midwest South WestUsing the data above, create a pie chart to determine the sales percentage for each region. Sales Region Percentage East Midwest South West Now, create a PivotTable to determine the monthly sales earned by each regich. Use that data to create a 2D clustered column chart. Based on that column bar chart, identify the regions that had the highest and lowest monthly sales for the entire year. Region Month Total Sales Region with Highest Earning Month Region with Lowest Earning MonthA 1 B Order Number C Order Date D Region E Rep F Product Ordered Units Ordered Price per Unit Total Sales
Step by Step Solution
There are 3 Steps involved in it

Get step-by-step solutions from verified subject matter experts