

Question: Needing some help with the R code In this problem set, we will use scan statistics to determine whether there are signicant hotspots or clusters
Needing some help with the R code

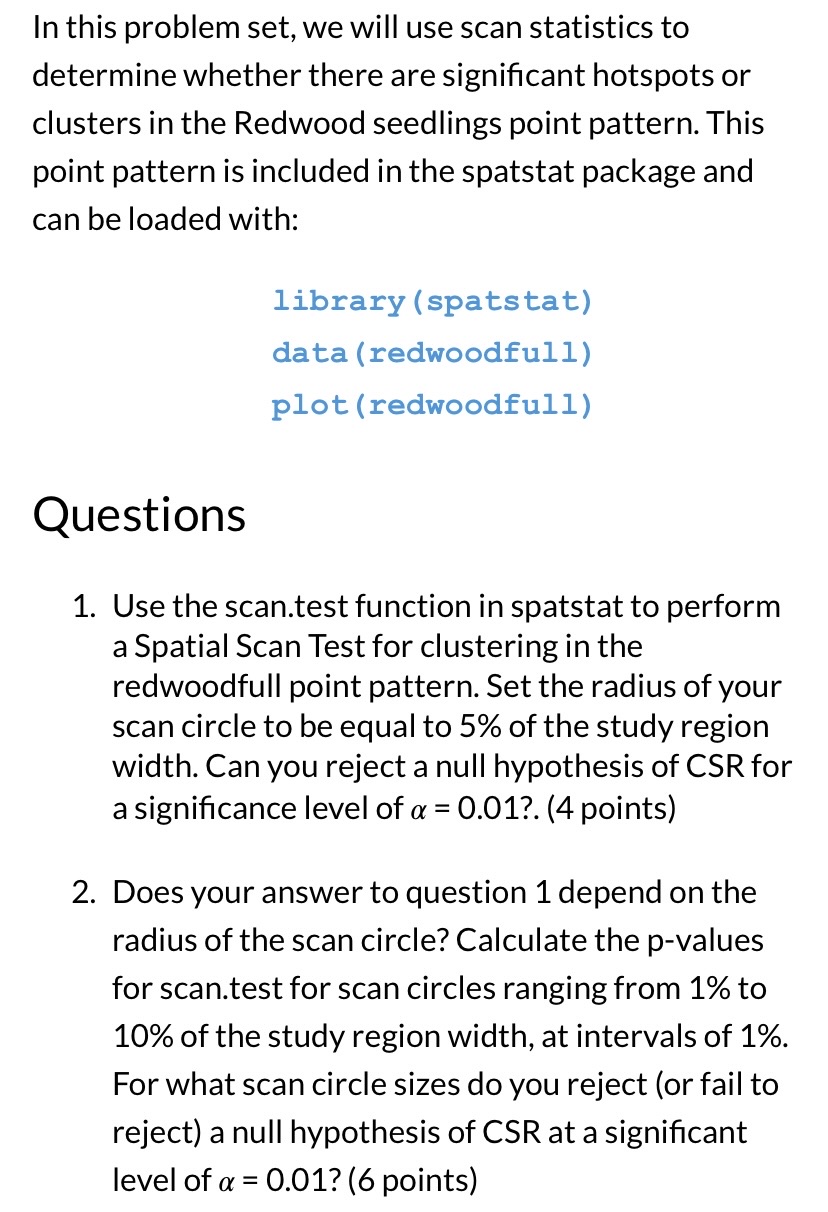
In this problem set, we will use scan statistics to determine whether there are signicant hotspots or clusters in the Redwood seedlings point pattern. This point pattern is included in the spatstat package and can be loaded with: library(spatstat) data(redwoodfull) plot(redwoodfull} Questions 1. Use the scan.test function in spatstat to perform a Spatial Scan Test for clustering in the redwoodfull point pattern. Set the radius of your scan circle to be equal to 5% of the study region width. Can you reject a null hypothesis of CSR for a signicance level of a = 001?. (4 points) 2. Does your answer to question 1 depend on the radius of the scan circle? Calculate the p-values for scan.test for scan circles ranging from 1% to 10% of the study region width, at intervals of 1%. For what scan circle sizes do you reject (or fail to reject) a null hypothesis of CSR at a signicant level of a: = 0.01? (6 points)
Step by Step Solution
There are 3 Steps involved in it

Get step-by-step solutions from verified subject matter experts