

Question: Net Present Value Method, Present Value Index, and Analysis for a service company Continental Railroad Company is evaluating three capital investment proposals by using the
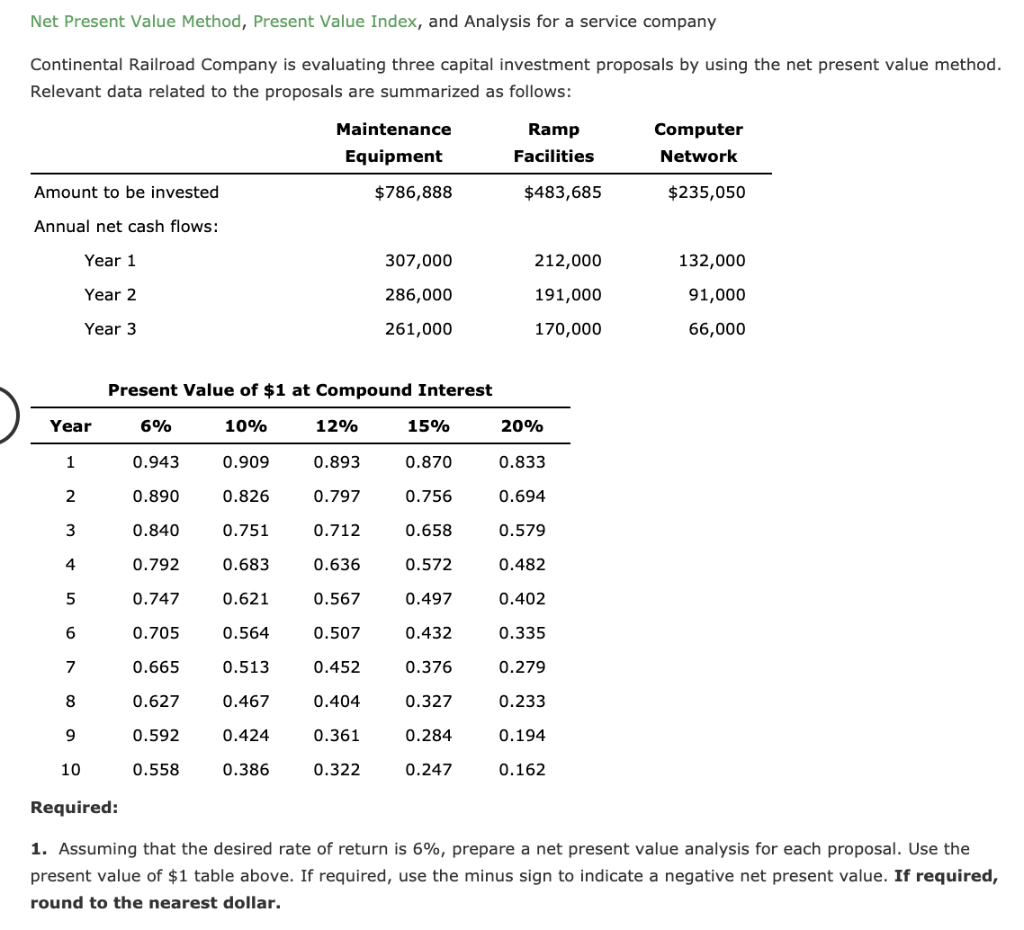
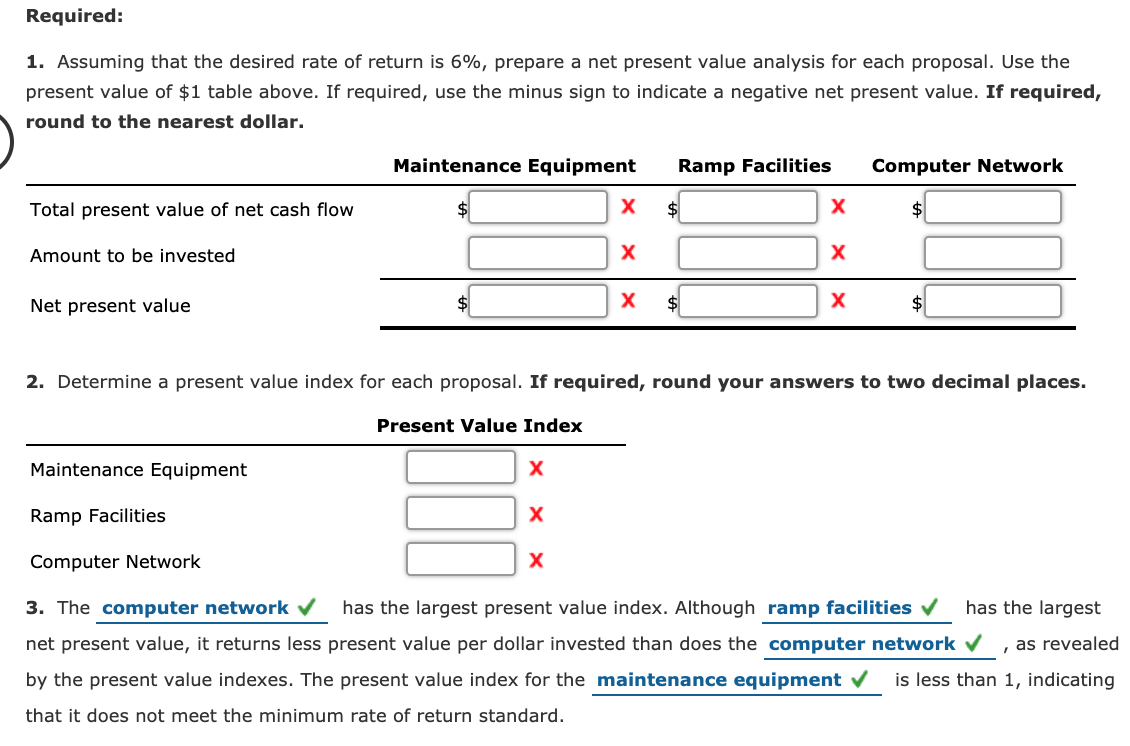
Net Present Value Method, Present Value Index, and Analysis for a service company Continental Railroad Company is evaluating three capital investment proposals by using the net present value method. Relevant data related to the proposals are summarized as follows: Maintenance Equipment Ramp Facilities Computer Network Amount to be invested $786,888 $483,685 $235,050 Annual net cash flows: Year 1 307,000 212,000 132,000 Year 2 191,000 91,000 286,000 261,000 Year 3 170,000 66,000 Present Value of $1 at Compound Interest Year 6% 10% 12% 15% 20% 0.943 0.909 0.893 0.870 0.833 2 0.890 0.826 0.797 0.756 0.694 3 0.840 0.751 0.712 0.658 0.579 4 0.792 0.683 0.636 0.572 0.482 5 0.747 0.621 0.567 0.497 0.402 6 0.705 0.564 0.507 0.432 0.335 7 0.665 0.513 0.452 0.376 0.279 8 0.627 0.467 0.404 0.327 0.233 9 0.592 0.424 0.361 0.284 0.194 10 0.558 0.386 0.322 0.247 0.162 Required: 1. Assuming that the desired rate of return is 6%, prepare a net present value analysis for each proposal. Use the present value of $1 table above. If required, use the minus sign to indicate a negative net present value. If required, round to the nearest dollar. Net Present Value Method, Present Value Index, and Analysis for a service company Continental Railroad Company is evaluating three capital investment proposals by using the net present value method. Relevant data related to the proposals are summarized as follows: Maintenance Equipment Ramp Facilities Computer Network Amount to be invested $786,888 $483,685 $235,050 Annual net cash flows: Year 1 307,000 212,000 132,000 Year 2 191,000 91,000 286,000 261,000 Year 3 170,000 66,000 Present Value of $1 at Compound Interest Year 6% 10% 12% 15% 20% 0.943 0.909 0.893 0.870 0.833 2 0.890 0.826 0.797 0.756 0.694 3 0.840 0.751 0.712 0.658 0.579 4 0.792 0.683 0.636 0.572 0.482 5 0.747 0.621 0.567 0.497 0.402 6 0.705 0.564 0.507 0.432 0.335 7 0.665 0.513 0.452 0.376 0.279 8 0.627 0.467 0.404 0.327 0.233 9 0.592 0.424 0.361 0.284 0.194 10 0.558 0.386 0.322 0.247 0.162 Required: 1. Assuming that the desired rate of return is 6%, prepare a net present value analysis for each proposal. Use the present value of $1 table above. If required, use the minus sign to indicate a negative net present value. If required, round to the nearest dollar
Step by Step Solution
There are 3 Steps involved in it

Get step-by-step solutions from verified subject matter experts