

Question: New tab * Home Gradebook X zy Section 5.7 - QNT/275T: Statistic: X + X CA https://learn.zybooks.com/zybook/QNT_275T_55318202/chapter/5/section/7?content_resource_id=42551262 G S Bookmarks b Suggested Sites Imported From
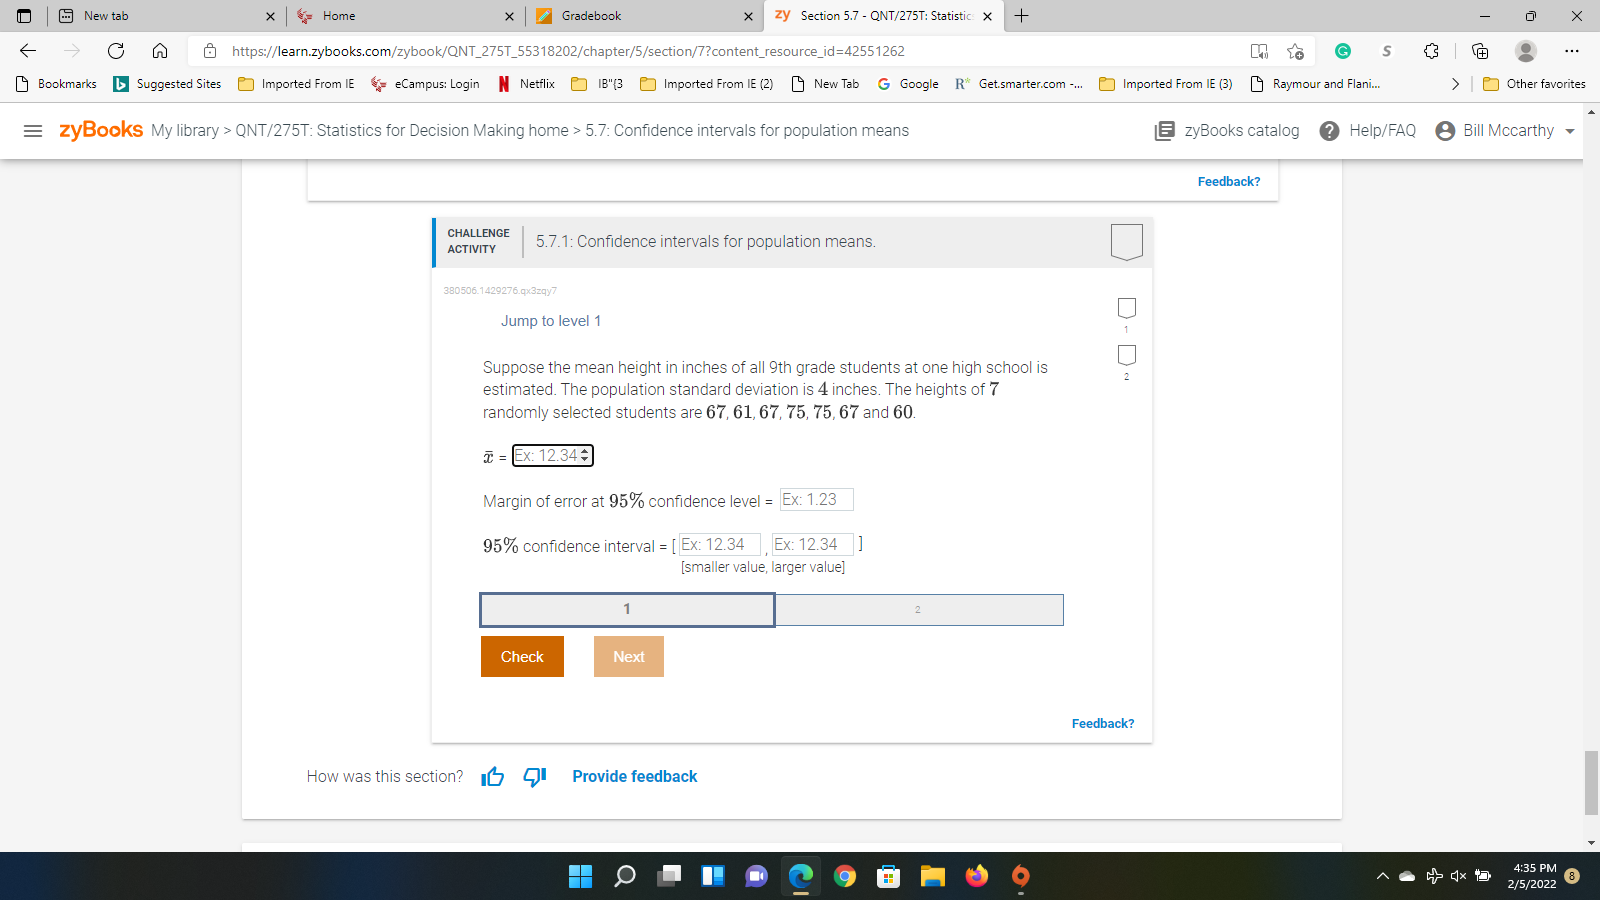
New tab * Home Gradebook X zy Section 5.7 - QNT/275T: Statistic: X + X CA https://learn.zybooks.com/zybook/QNT_275T_55318202/chapter/5/section/7?content_resource_id=42551262 G S Bookmarks b Suggested Sites Imported From IE = Campus: Login N Netflix ) 18"(3 ) Imported From IE (2) New Tab G Google R* Getsmarter.com -. [ Imported From IE (3) Raymour and Flani. > | Other favorites =zyBooks My library > QNT/275T: Statistics for Decision Making home > 5.7: Confidence intervals for population means zyBooks catalog ? Help/FAQ @ Bill Mccarthy Feedback? CHALLENGE ACTIVITY 5.7.1: Confidence intervals for population means. 380506.1429276.qx3zqy7 Jump to level 1 Suppose the mean height in inches of all 9th grade students at one high school is estimated. The population standard deviation is 4 inches. The heights of 7 randomly selected students are 67, 61, 67, 75, 75, 67 and 60. D = EX: 12.34+ Margin of error at 95% confidence level = Ex: 1.23 95% confidence interval = [ Ex: 12.34 Ex: 12.34 ] [smaller value, larger value] 1 2 Check Next Feedback? How was this section? 1 1 Provide feedback O 4:35 PM 2/5/2022 8
Step by Step Solution
There are 3 Steps involved in it

Get step-by-step solutions from verified subject matter experts