

Question: Next, perform some sensitivity analysis. - Use the Upside and Downside scenarios to compute Upside and Downside stock prices. - Using the base case, check
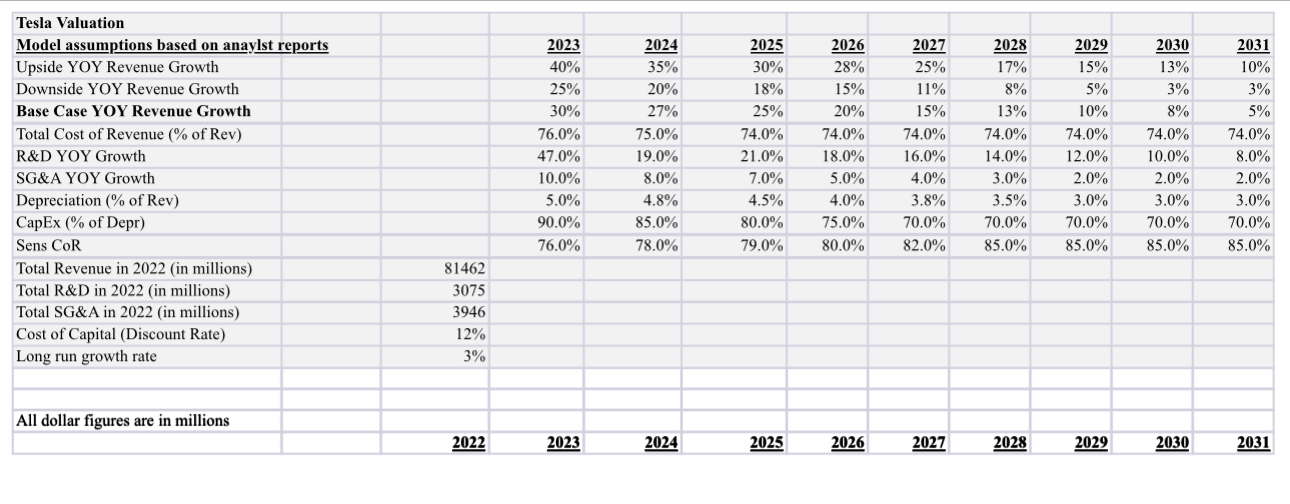
Next, perform some sensitivity analysis. - Use the Upside and Downside scenarios to compute Upside and Downside stock prices. - Using the base case, check the sensitivity of the valuation to the assumptions about Tesla's cost of revenue. The sheet assumes that Tesla will be able to stabilize gross margins at 24%. This would be fairly high for the automotive industry, where gross margins can be as low as 10%. Calculate Tesla's stock price if Cost of Revenue was 76\%, 78\%, 79\%, 80%, and 82% in years 2023,2024 , 2025, 2026 and 2027, and then 85% from 2028 onward. - Using the base case, check the sensitivity of the valuation to the assumptions about Tesla's cost of R\&D. The sheet assumes that eventually Tesla will be able to hold R\&D growth to only 8% per year. As the space becomes more competitive, Tesla may have to keep R\&D growth at 16% in order to keep its lead. Calculate Tesla's stock price if R\&D levels out at 16% growth from 2027 onward. \begin{tabular}{|c|c|c|c|c|c|c|c|c|c|c|} \hline \multirow{2}{*}{\begin{tabular}{l} Tesla Valuation \\ Model assumptions based on anaylst reports \end{tabular}} & & & & & & & & & & \\ \hline \multirow{2}{*}{\multicolumn{2}{|c|}{\begin{tabular}{l} Model assumptions based on anaylst reports \\ Upside YOY Revenue Growth \end{tabular}}} & 2023 & 2024 & 2025 & 2026 & 2027 & 2028 & 2029 & 2030 & 2031 \\ \hline & & 40% & 35% & 30% & 28% & 25% & 17% & 15% & 13% & 10% \\ \hline & 25% & 20% & 18% & 15% & 11% & 8% & 5% & 3% & 3% \\ \hline \multicolumn{2}{|l|}{ Base Case YOY Revenue Growth } & 30% & 27% & 25% & 20% & 15% & 13% & 10% & 8% & 5% \\ \hline \multicolumn{2}{|l|}{ Total Cost of Revenue (\% of Rev) } & 76.0% & 75.0% & 74.0% & 74.0% & 74.0% & 74.0% & 74.0% & 74.0% & 74.0% \\ \hline \multicolumn{2}{|l|}{ R\&D YOY Growth } & 47.0% & 19.0% & 21.0% & 18.0% & 16.0% & 14.0% & 12.0% & 10.0% & 8.0% \\ \hline \multicolumn{2}{|l|}{ SG\&A YOY Growth } & 10.0% & 8.0% & 7.0% & 5.0% & 4.0% & 3.0% & 2.0% & 2.0% & 2.0% \\ \hline \multicolumn{2}{|l|}{ Depreciation (\% of Rev) } & 5.0% & 4.8% & 4.5% & 4.0% & 3.8% & 3.5% & 3.0% & 3.0% & 3.0% \\ \hline \multicolumn{2}{|l|}{ CapEx (\% of Depr) } & 90.0% & 85.0% & 80.0% & 75.0% & 70.0% & 70.0% & 70.0% & 70.0% & 70.0% \\ \hline \multicolumn{2}{|l|}{ Sens CoR } & 76.0% & 78.0% & 79.0% & 80.0% & 82.0% & 85.0% & 85.0% & 85.0% & 85.0% \\ \hline \multicolumn{2}{|l|}{ Total Revenue in 2022 (in millions) } & & & & & & & & & \\ \hline Total R\&D in 2022 (in millions) & 3075 & & & & & & & & & \\ \hline Total SG\&A in 2022 (in millions) & 3946 & & & & & & & & & \\ \hline Cost of Capital (Discount Rate) & 12% & & & & & & & & & \\ \hline Long run growth rate & 3% & & & & & & & & & \\ \hline & & & & & & & & & & \\ \hline \multicolumn{11}{|l|}{ All dollar figures are in millions } \\ \hline & 2022 & 2023 & 2024 & 2025 & 2026 & 2027 & 2028 & 2029 & 2030 & 2031 \\ \hline \end{tabular}
Step by Step Solution
There are 3 Steps involved in it

Get step-by-step solutions from verified subject matter experts