

Question: Next question Identify the data as either time series or cross-sectional. Stock Market Average Price . . . The accompanying table shows the average price
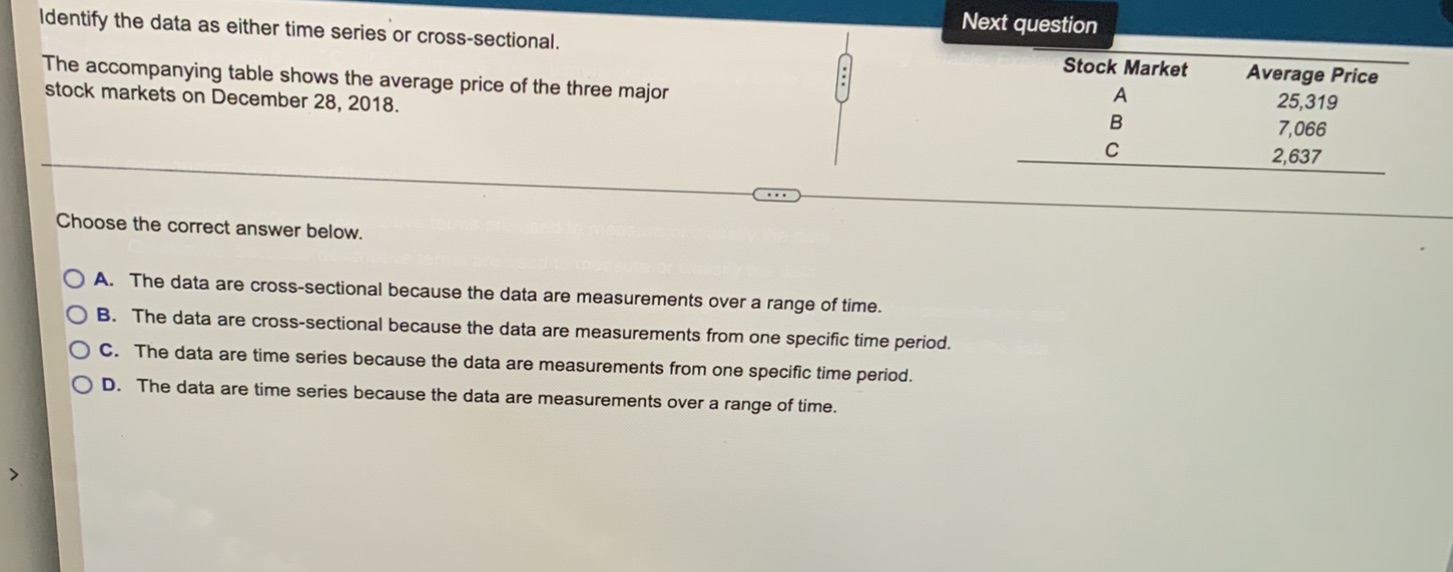
Next question Identify the data as either time series or cross-sectional. Stock Market Average Price . . . The accompanying table shows the average price of the three major A 25,319 stock markets on December 28, 2018. 7,066 2,637 Choose the correct answer below. O A. The data are cross-sectional because the data are measurements over a range of time. O B. The data are cross-sectional because the data are measurements from one specific time period. O C. The data are time series because the data are measurements from one specific time period. O D. The data are time series because the data are measurements over a range of time
Step by Step Solution
There are 3 Steps involved in it

Get step-by-step solutions from verified subject matter experts