

Question: Next question Soe Table 2.5 showing financial statement data and stock price data for Mydeco Corp a. By what percentage did Mydeco's revenues grow each
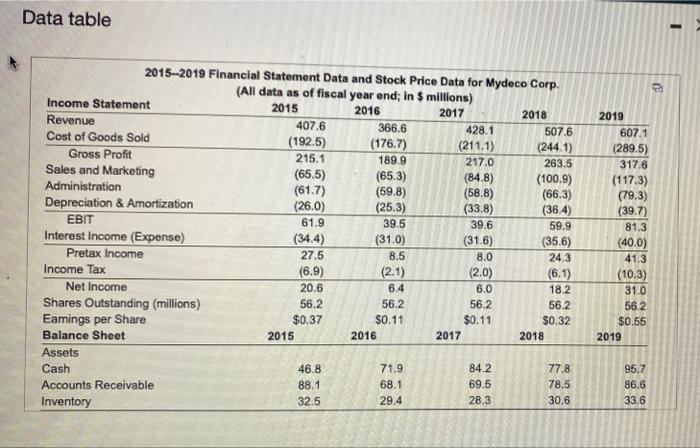
Next question Soe Table 2.5 showing financial statement data and stock price data for Mydeco Corp a. By what percentage did Mydeco's revenues grow each year from 2016-20197 b. By what percentage did net income grow each year? c. Why might the growth rates of revenues and not income differ? GD a. By what percentage did Mydeco's revenues grow each year from 2016-2017 The revenues growth far year 2016 is % (Round to two decimal places.) Data table 2015-2019 Financial Statement Data and Stock Price Data for Mydeco Corp. (All data as of fiscal year end; in $ millions) Income Statement 2015 2016 2017 2018 Revenue 407.6 366.6 428.1 507.6 Cost of Goods Sold (192.5) (176.7) (211.1) (244.1) Gross Profit 215.1 189.9 217.0 263.5 Sales and Marketing (65.5) (65.3) (84.8) (100.9) Administration (61.7) (59.8) (58.8) (66.3) Depreciation & Amortization (26.0) (25.3) (33.8) (36.4) EBIT 61.9 39.5 39.6 59.9 Interest Income (Expense) (34.4) (31.0) (31.6) (35.6) Pretax Income 27.5 8.5 8.0 24.3 Income Tax (6.9) (2.1) (2.0) (6.1) Net Income 20.6 6.4 6.0 18.2 Shares Outstanding (millions) 56.2 56.2 56.2 56.2 Earings per Share $0.37 $0.11 $0.11 $0.32 Balance Sheet 2015 2016 2017 2018 Assets Cash 46.8 71.9 84.2 77.8 Accounts Receivable 88.1 68.1 69.5 78.5 32.5 Inventory 29.4 28.3 30.6 2019 607.1 (289.5) 317.6 (117.3) (79.3) (39.7) 81.3 (40.0) 41.3 (10.3) 31.0 56.2 $0.55 2019 95.7 86.6 33.6
Step by Step Solution
There are 3 Steps involved in it

Get step-by-step solutions from verified subject matter experts