

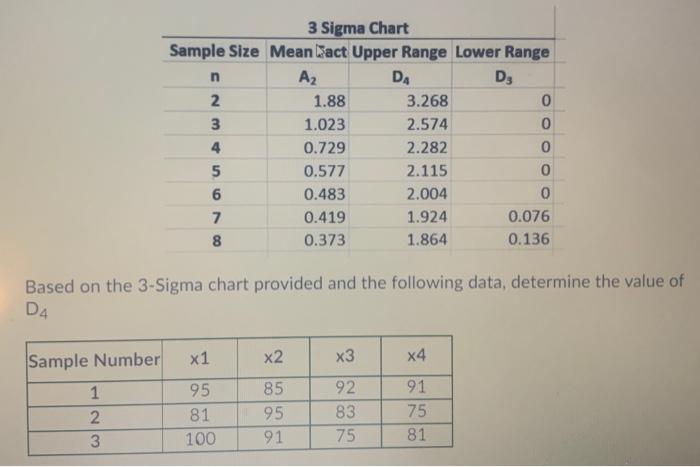
Question: Nm w 3 Sigma Chart Sample Size Mean Wact Upper Range Lower Range n Az DA D 2 1.88 3.268 0 3 1.023 2.574 0
Step by Step Solution
There are 3 Steps involved in it
1 Expert Approved Answer
Step: 1 Unlock

Question Has Been Solved by an Expert!
Get step-by-step solutions from verified subject matter experts
Step: 2 Unlock
Step: 3 Unlock