

Question: No Excel Please solve by Hand no excel. Please do all parts. 2. (10 pt each) The following tables show the information on the returns
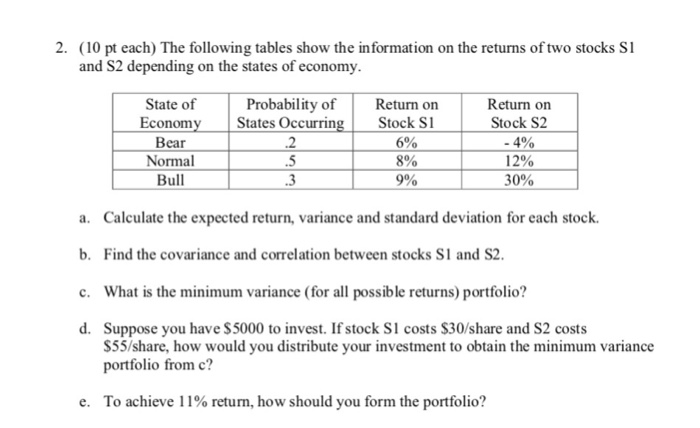
2. (10 pt each) The following tables show the information on the returns of two stocks S1 and S2 depending on the states of economy State of Probability of States Occurrin .2 .5 .3 Return on Stock Si 6% 8% 900 Return on Stock S2 -4% 12% 30% Econom Bear Normal Bull Calculate the expected return, variance and standard deviation for each stock. Find the covariance and correlation between stocks S1 and S2 What is the minimum variance (for all possible returns) portfolio? a. b. c. d. Suppose you have $5000 to invest. If stock S1 costs $30/share and S2 costs S55/share, how would you distribute your investment to obtain the minimum variance portfolio from c? e. To achieve l 1% return, how should you form the portfolio
Step by Step Solution
There are 3 Steps involved in it

Get step-by-step solutions from verified subject matter experts