

Question: no excel please. solve it by hand 2. (10 pt each) The following tables show the information on the returns of two stocks S1 and
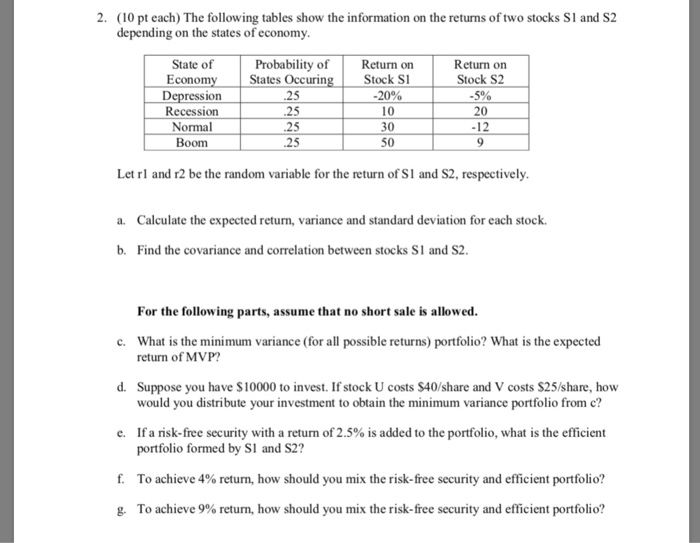
2. (10 pt each) The following tables show the information on the returns of two stocks S1 and S2 depending on the states of economy State of Probability of Return on States Occuring Return on Stock S2 5% 20 -12 Econo Stock Sl 20% ression Recession Normal Boom .25 .25 .25 30 50 Let ri and r2 be the random variable for the return of S1 and S2, respectively a. Calculate the expected return, variance and standard deviation for each stock b. Find the covariance and correlation between stocks S1 and S2. For the following parts, assume that no short sale is allowed c. What is the minimum variance (for all possible returns) portfolio? What is the expected return of MVP d. Suppose you have $10000 to invest. If stock U costs $40/share and V costs $25/share, how would you distribute your investment to obtain the minimum variance portfolio from c? e. If a risk-free security with a return of 2.5% is added to the portfolio, what is the efficient portfolio formed by SI and S2? To achieve 4% return, how should you mix the risk-free security and efficient portfolio? To achieve 9% return, how should you mix the risk-free security and efficient portfolio? f g
Step by Step Solution
There are 3 Steps involved in it

Get step-by-step solutions from verified subject matter experts