Question: no Excel solution please 11. Following table presents 20 subgroups of 5 measurements on the time it takes to service a customer. Sample Number

no Excel solution please no Excel solution please " 11. Following table
" 11. Following table presents 20 subgroups of 5 measurements on the time it takes to service a customer. Sample Number & R Sample Number R 131 28 57 40 50 1 136 41 2 126 12 147 134 39 13 129 4 118 30 14 138 9 5 131 43 15 126 55 6 127 16 126 54 43 7 112 36 17 130 8 127 46 18 159 53 9 151 47 19 148 38 10 134 70 20 141 32 a. Calculate #land +2 -levels, UCL, LCL and CL for X and R control charts. (15 Points) b. Set up X and control charts for this process. (10 Points) c. Is this process in statistical control? If we have assignable causes for outliers what will be the revised control limits? (10 points) d. The process specifications are at 130 + 25. The quality characteristic has a normal distribution. Estimate the actual Process Capability and comment on the result. (10 Points)

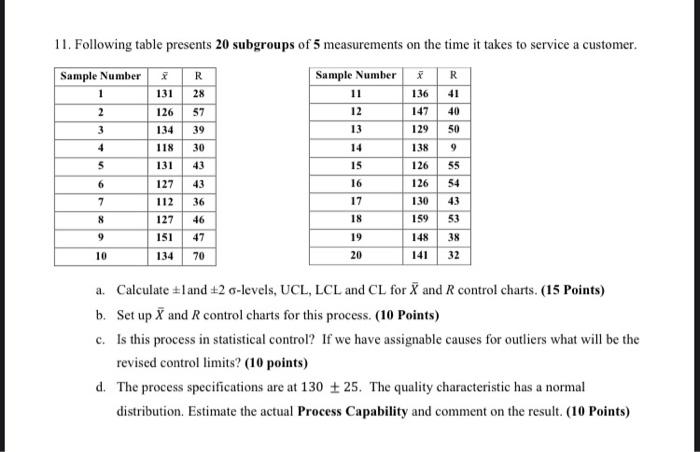
Step by Step Solution

There are 3 Steps involved in it

1 Expert Approved Answer
Step: 1 Unlock blur-text-image
Question Has Been Solved by an Expert!

Get step-by-step solutions from verified subject matter experts

Step: 2 Unlock
Step: 3 Unlock

Students Have Also Explored These Related General Management Questions!