

Question: no explaination needed only need answer I will rate thank you so much Question 31 1 pts The graphical format used to display the relationship
no explaination needed only need answer 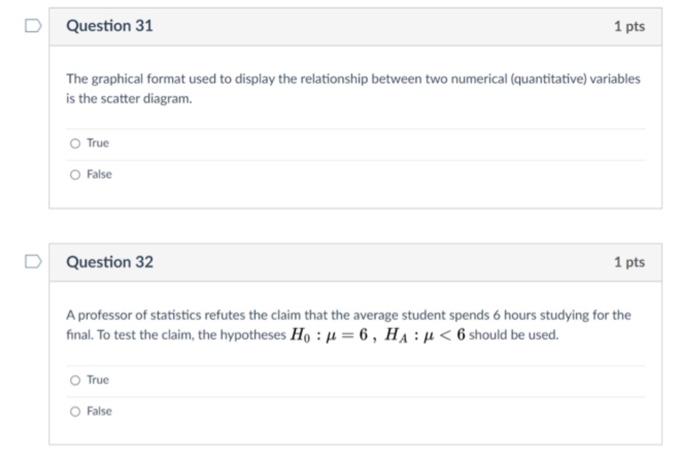
I will rate thank you so much
Question 31 1 pts The graphical format used to display the relationship between two numerical (quantitative) variables is the scatter diagram. O True O False Question 32 1 pts A professor of statistics refutes the claim that the average student spends 6 hours studying for the final. To test the claim, the hypotheses Ho: = 6, HA
Step by Step Solution
There are 3 Steps involved in it
1 Expert Approved Answer
Step: 1 Unlock

Question Has Been Solved by an Expert!
Get step-by-step solutions from verified subject matter experts
Step: 2 Unlock
Step: 3 Unlock