

Question: No explanation needed Chi-Square Distribution Table F Distribution Table (a = .01) F Distribution (a = .025) F Distribution Table (a =.05) F Distribution Table
No explanation needed
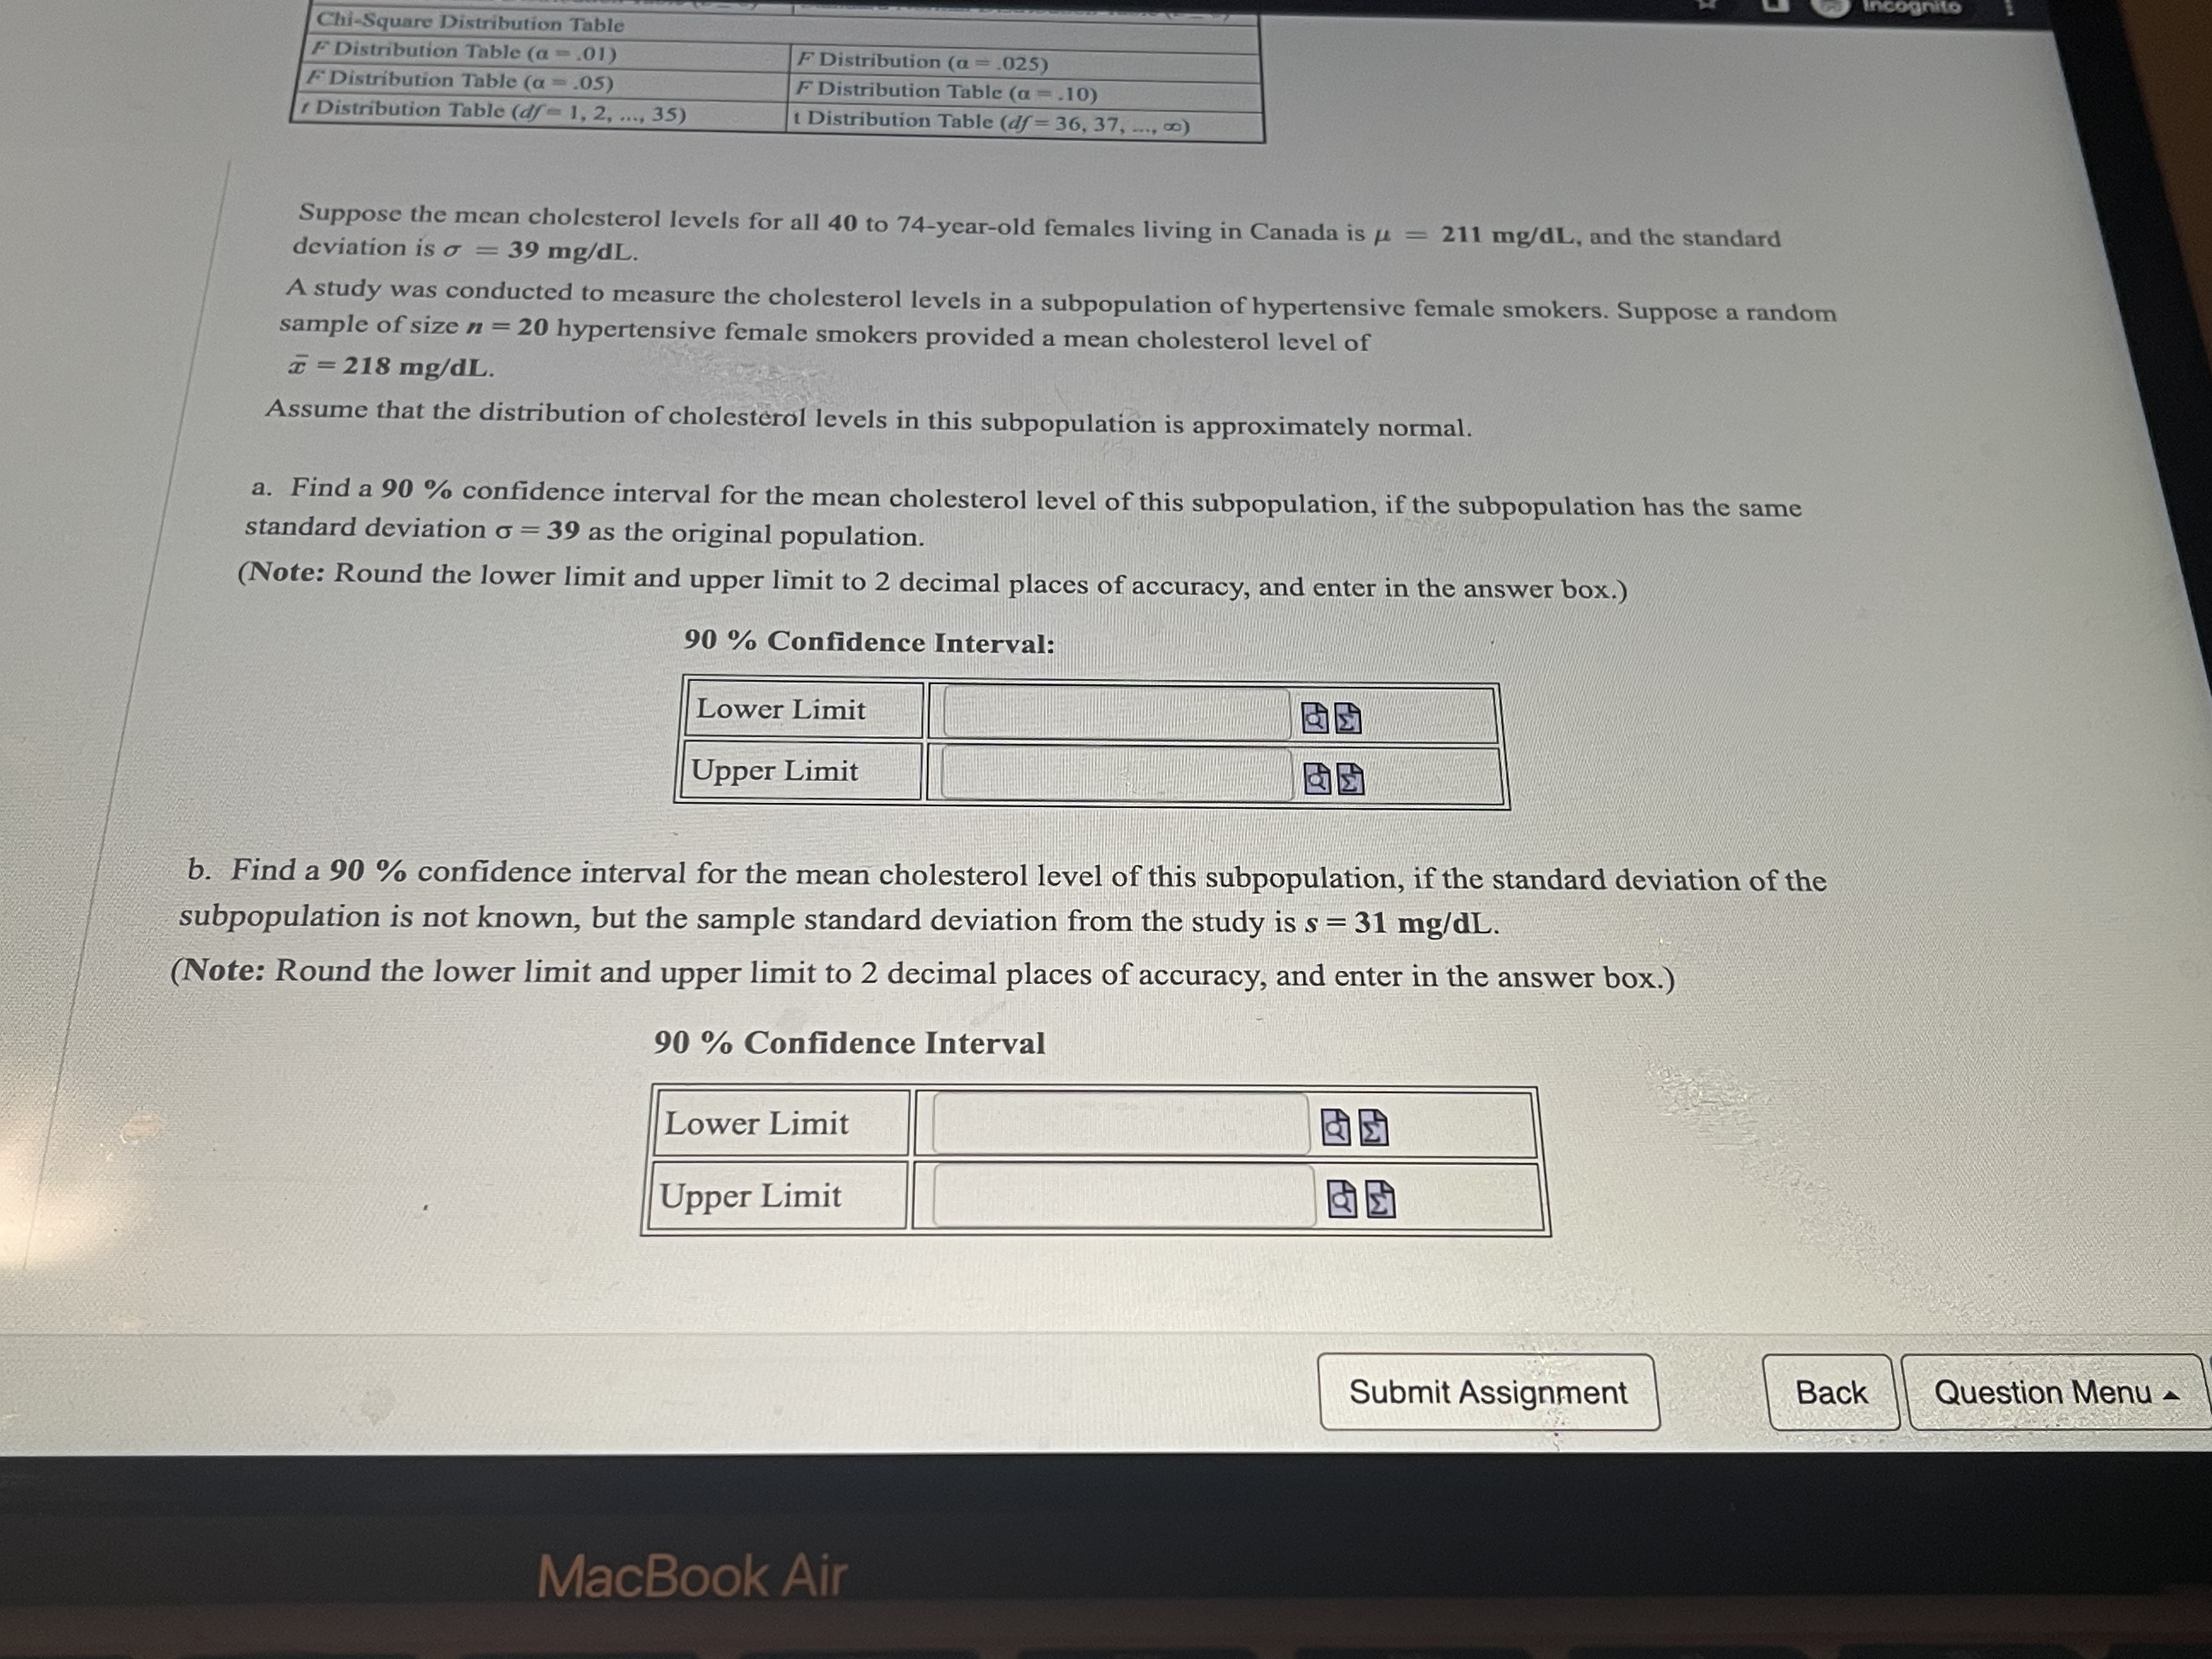
Chi-Square Distribution Table F Distribution Table (a = .01) F Distribution (a = .025) F Distribution Table (a =.05) F Distribution Table (a = 10) Distribution Table (df = 1, 2, ..., 35) 1 Distribution Table (df = 36, 37, .... 00) Suppose the mean cholesterol levels for all 40 to 74-year-old females living in Canada is / = 211 mg/dL, and the standard deviation is o = 39 mg/dL. A study was conducted to measure the cholesterol levels in a subpopulation of hypertensive female smokers. Suppose a random sample of size n = 20 hypertensive female smokers provided a mean cholesterol level of I = 218 mg/dL. Assume that the distribution of cholesterol levels in this subpopulation is approximately normal. a. Find a 90 % confidence interval for the mean cholesterol level of this subpopulation, if the subpopulation has the same standard deviation o = 39 as the original population. (Note: Round the lower limit and upper limit to 2 decimal places of accuracy, and enter in the answer box.) 90 % Confidence Interval: Lower Limit Upper Limit b. Find a 90 % confidence interval for the mean cholesterol level of this subpopulation, if the standard deviation of the subpopulation is not known, but the sample standard deviation from the study is s = 31 mg/dL. (Note: Round the lower limit and upper limit to 2 decimal places of accuracy, and enter in the answer box.) 90 % Confidence Interval Lower Limit Upper Limit Submit Assignment Back Question Menu - MacBook Air
Step by Step Solution
There are 3 Steps involved in it

Get step-by-step solutions from verified subject matter experts