

Question: no explanation needed just answer thanks - Reference Present Value of Annuity of $1 Periods 1% 2% 3% 4% 5% 6% 8% 10% 12% 14%
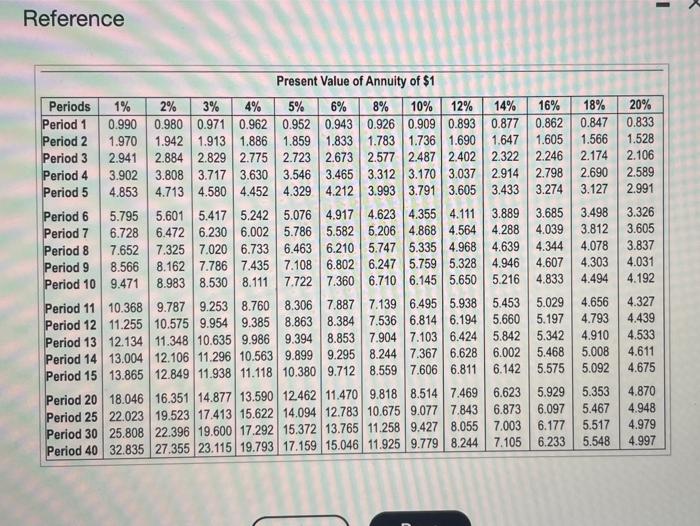
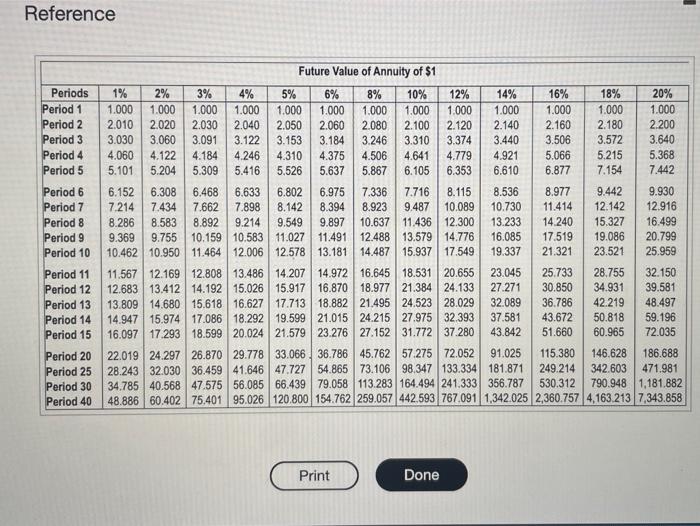
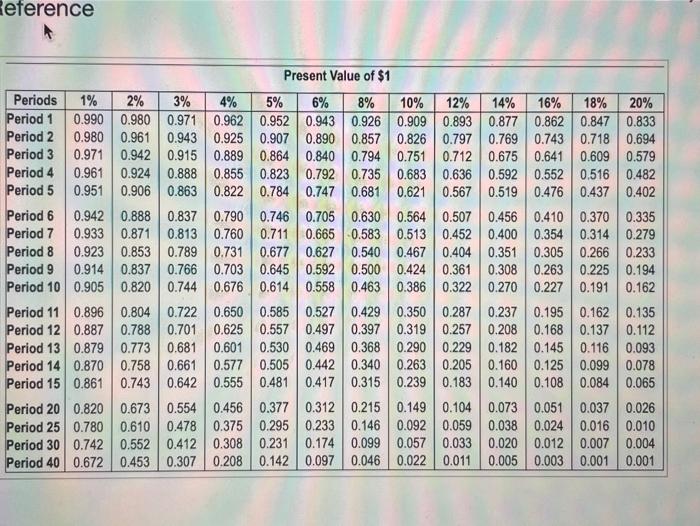
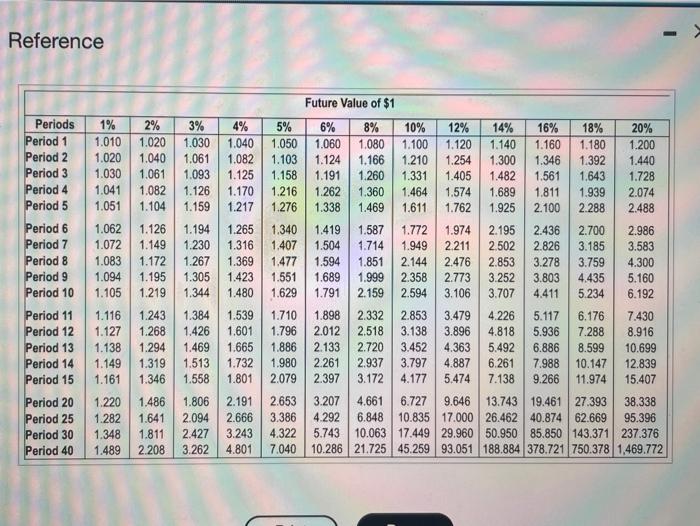
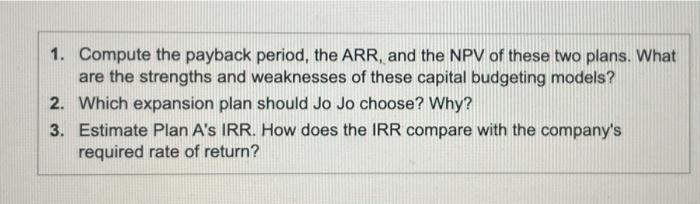
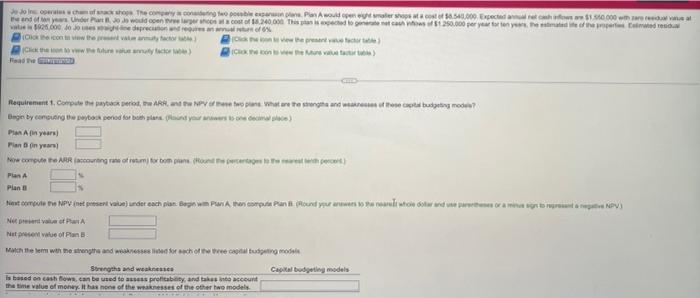


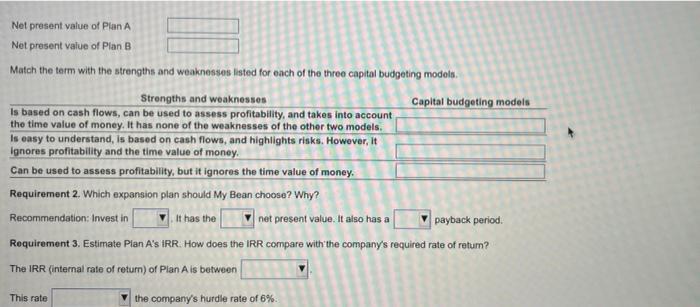
- Reference Present Value of Annuity of $1 Periods 1% 2% 3% 4% 5% 6% 8% 10% 12% 14% 16% 18% 20% Period 1 0.990 0.980 0.971 0.962 0.952 0.943 0.926 0.909 0.893 0.877 0.862 0.847 0.833 Period 2 1.970 1.942 1.913 1.886 1.859 1.833 1.783 1.736 1.690 1.647 1.605 1.566 1.528 Period 3 2.9412.884 2.829 2.775 2.723 2.673 2.577 2.487 2.402 2.322 2.246 2.174 2.106 Period 4 3.902 3.808 3.717 3.630 3.546 3.465 3.312 3.170 3.037 2.914 2.798 2.690 2.589 Period 5 4.853 4.713 4.580 4.452 4.329 4.2123.993 3.791 3.605 3.433 3.274 3.127 2.991 Period 6 5.795 5.601 5.417 5.242 5.076 4.917 4.623 4.355 4.111 3.889 3.685 3.498 3.326 Period 7 6.728 6.472 6.230 6.002 5.786 5.5825.206 4.8684.564 4.288 4.039 3.812 3.605 Period 8 7.652 7.325 7.020 6.733 6.463 6.210 5.747 5.335 4.968 4.639 4.344 4.078 3.837 Period 9 8.566 8.1627.786 7.435 7.108 6.802 6.247 5.759 5.328 4.946 4.607 4.303 4.031 Period 10 9.471 8.983 8.530 8.111 7.722 7.360 6.710 6.145 5.650 5.216 4.833 4.494 4.192 Period 11 10.368 9.787 9.253 8.760 8.306 7.887 7.139 6.495 5.938 5.453 5.029 4.656 4.327 Period 12 11.255 10.575 9.954 9.385 8.863 8.384 7.536 6.814 6.194 5.660 5.197 4.793 4.439 Period 13 12.134 11.348 10.635 9.986 9.394 8.853 7.904 7.103 6.424 5.842 5.342 4.910 4.533 Period 14 13.004 12.106 11.296 10.563 9.899 9.295 8.244 7.367 | 6.628 6.002 5.468 5.008 4.611 Period 15 13.865 12.849 11.938 11.118 10.380 9.712 8.559 7.606 6.811 6.142 5.575 5.092 4.675 Period 20 18.046 16.351 14.877 13.590 12.462 11.470 9.818 8.5147.469 6.623 5.929 5.353 4.870 Period 25 22.023 19.523 17.413 15.622 14.094 12.783 10.675 9.077 7.8436.873 6.097 5.467 4.948 Period 30 25.808 22.396 19.600 17.292 15.372 13.765 11.258 9.427 8.055 7.003 6.177 5.517 4.979 Period 40 32.835 27.355 23.115 19.793 17.159 15.046 11.925 9.7798.244 7.105 6.233 5.548 4.997 Reference Future Value of Annuity of $1 Periods 1% 2% 3% 4% 5% 6% 8% 10% 12% 14% 16% 18% 20% Period 1 1.000 1.000 1.000 1.000 1.000 1.000 1.000 1.000 1.000 1.000 1.000 1.000 1.000 Period 2 2.010 2.020 2.030 2.040 2.050 2.060 2.080 2.100 2.120 2.140 2.160 2.180 2.200 Period 3 3.030 3.060 3.091 3.122 3.153 3.184 3.246 3.310 3.374 3.440 3.506 3.572 3.640 Period 4 4.060 4.122 4.184 4.246 4.310 4.375 4.506 4.641 4.779 4.921 5.066 5.215 5.368 Period 5 5.101 5.204 5.309 5.416 5.526 5.637 5.867 6.105 6.353 6.610 6.877 7.154 7.442 Period 6 6.152 6.308 6.468 6.633 6.802 6.975 7.336 7.716 8.115 8.536 8.977 9.442 9.930 Period 7 7.214 7.434 7.662 7.898 8.142 8.394 8.923 9.487 10.089 10.730 11.414 12.142 12.916 Period 8 8.286 8.583 8.892 9.214 9.549 9.897 10.637 11.436 12.300 13.233 14.240 15,327 16.499 Period 9 9.369 9.755 10.159 10.583 11.027 11.491 12.488 13.579 14.776 16.085 17.519 19.086 20.799 Period 10 10.462 10.950 11.464 12.006 12.578 13.181 14.487 15.937 17.549 19.337 21.321 23.521 25.959 Period 11 11.567 12.169 12.808 13.486 14.207 14.972 16.645 18.531 20.655 23.045 25.733 28.755 32.150 Period 12 12.683 13.412 14.192 15.026 15.917 16.870 18.977 21.384 24.133 27.271 30.850 34.931 39.581 Period 13 13.809 14.680 15.618 16.627 17.713 18.882 21.495 24.523 28.029 32.089 36.786 42.219 48.497 Period 14 14.947 15.974 17.086 18.292 19.599 21.015 24.215 27.975 32.393 37.581 43.672 50.818 59.196 Period 15 16.097 17.293 18.599 20.024 21.579 23.276 27.152 31.772 37.280 43.842 51.660 60.965 72.035 Period 20 22.019 24.297 26.870 29.778 33,066 36.786 45.762 57.275 72.052 91.025 115.380 146.628 186.688 Period 25 28.243 32.030 36.459 41.646 47.727 54.865 73.106 98.347 133.334 181.871 249.214 342.603 471.981 Period 30 34.785 40.568 47.575 56.085 66.439 79.058 113.283 164.494 241.333 356.787 530.312 790.948 1,181.882 Period 40 48.886 60.402 75.401 95.026 120.800 154.762 259.057 442.593 767.091 1,342.025 2,360.757 4.163.213 7.343.858 Print Done Reference Present Value of $1 Periods 1% 2% 3% 4% 5% 6% 8% 10% 12% 14% 16% 18% 20% Period 1 0.990 0.980 0.971 0.962 0.952 0.943 0.926 0.9090.893 0.877 0.862 0.847 0.833 Period 2 0.980 0.961 0.943 0.925 0.907 0.890 0.857 0.826 0.797 0.769 0.743 0.7180.694 Period 3 0.971 0.942 0.915 0.889 0.864 0.840 0.794 0.751 0.712 0.675 0.641 0.609 0.579 Period 4 0.961 0.924 0.888 0.855 0.823 0.792 0.735 0.683 0.636 0.592 0.552 0.516 0.482 Period 5 0.951 0.906 0.863 0.822 0.784 0.747 0.681 0.621 0.567 0.519 0.476 0.437 0.402 Period 6 0.942 0.888 0.837 0.790 0.746 0.705 0.630 0.564 0.507 0.456 0.410 0.370 0.335 Period 7 0.933 0.871 0.813 0.760 0.711 0.665 0.583 0.513 0.452 0.400 0.354 0.314 0.279 Period 8 0.923 0.853 0.789 0.731 0.677 0.627 0.540 0.467 0.404 0.351 0.305 0.266 0.233 Period 9 0.914 0.837 0.766 0.703 0.6450.592 0.500 0.424 0.361 0.308 0.263 0.225 0.194 Period 10 0.905 0.820 0.744 0.676 0.614 0.558 0.463 0.386 0.322 0.270 0.227 0.191 0.162 Period 11 0.896 0.804 0.722 0.650 0.585 0.527 0.429 0.350 0.287 0.237 0.195 0.162 0.135 Period 12 0.887 0.788 0.701 0.625 0.557 0.497 0.397 0.319 0.257 0.208 0.168 0.137 0.112 Period 13 0.879 0.773 0.681 0.601 0.530 0.469 0.368 0.290 0.229 0.182 0.145 0.116 0.093 Period 14 0.870 0.758 0.661 0.577 0.505 0.442 0.340 0.263 0.205 0.160 0.125 0.099 0.078 Period 15 0.861 0.743 0.642 0.555 0.481 0.417 0.315 0.239 0.183 0.140 0.108 0.084 0.065 Period 20 0.820 0.673 0.554 0.456 0.377 0.312 0.215 0.149 0.104 0.073 0.051 0.037 0.026 Period 25 0.780 0.610 0.478 0.375 0.295 0.233 0.146 0.092 0.059 0.038 0.024 0.016 0.010 Period 30 0.742 0.552 0.412 0.308 0.231 0.174 0.099 0.057 0.033 0.020 0.012 0.007 0.004 Period 40 0.672 0.453 0.307 0.208 0.142 0.097 0.046 0.022 0.011 0.005 0.003 0.001 0.001 Reference 1% 1.010 1.020 1.030 1.041 1.051 1.062 1.072 1.083 1.094 1.105 2% 1.020 1.040 1.061 1.082 1.104 3% 1.030 1.061 1.093 1.126 1.159 4% 1.040 1.082 1.125 1.170 1.217 5% 1.050 1.103 1.158 1.216 1.276 Future Value of $1 6% 8% 1.060 1.080 1.124 1.166 1.191 1.260 1.262 1.360 1.338 1.469 10% 1.100 1.210 1.331 1.464 1.611 1.772 1.949 2.144 2.358 2.594 12% 1.120 1.254 1.405 1.574 1.762 Periods Period 1 Period 2 Period 3 Period 4 Period 5 Period 6 Period 7 Period 8 Period 9 Period 10 Period 11 Period 12 Period 13 Period 14 Period 15 Period 20 Period 25 Period 30 Period 40 14% 1.140 1.300 1.482 1.689 1.925 2.195 2.502 2.853 3.252 3.707 16% 1.160 1.346 1.561 1.811 2.100 18% 1.180 1.392 1.643 1.939 2.288 20% 1.200 1.440 1.728 2.074 2.488 1.126 1.149 1.172 1.195 1.219 1.194 1.230 1.267 1.305 1.344 1.265 1.316 1.369 1.423 1.480 1.340 1.407 1.477 1.551 1.629 1.419 1.504 1.594 1.689 1.791 1.587 1.714 1.851 1.999 2.159 1.974 2.211 2.476 2.773 3.106 2.436 2.826 3.278 3.803 4.411 2.700 3.185 3.759 4.435 5.234 2.986 3.583 4.300 5.160 6.192 1.116 1.127 1.138 1.149 1.161 1.243 1.268 1.294 1.319 1.346 1.384 1.426 1.469 1.513 1.558 1.539 1.601 1.665 1.732 1.801 1.710 1.796 1.886 1.980 2.079 1.898 2.012 2.133 2.261 2.397 2.332 2.518 2.720 2.937 3.172 2.853 3.138 3.452 3.797 4.177 3.479 3.896 4.363 4.887 5.474 4.226 4.818 5.492 6.261 7.138 5.117 5.936 6.886 7.988 9.266 6.176 7.288 8.599 10.147 11.974 7.430 8.916 10.699 12.839 15.407 1.220 1.282 1.348 1.489 1.486 1.641 1.811 2.208 1.806 2.094 2.427 3.262 2.191 2.666 3.243 4.801 2.653 3.386 4.322 7.040 3.207 4.661 6.727 9.646 13.743 19.461 27.393 38.338 4.292 6.848 10.835 17.000 26.462 40.874 62.669 95.396 5.743 10.063 17.449 29.960 50.950 85.850 143.371 237.376 10.286 21.725 45.259 93.051 188.884 378.721 750.378 1.469.772 1. Compute the payback period, the ARR, and the NPV of these two plans. What are the strengths and weaknesses of these capital budgeting models? 2. Which expansion plan should Jo Jo choose? Why? 3. Estimate Plan A's IRR. How does the IRR compare with the company's required rate of return? Join the the coming to be a would water cost of $850.000 Expected to the wat end of the Part would come out of 18.240.000 This is et ca 350.000 per year for tenyered 5926000 60 in depreciation of Com vow the Requrumune 1, comune sy bers, WARR. and we are o pure what are the strengere and was the couple budgeting room? Begin by cong the payback period for both plans for your ow) Pyears Plannya www.comun AHR securing my brom pune Montepercentage of a percent) Plan Plan Hient compare to Mpy met persent vale under each pila Bogowe Para han compita Pian . plound your andre so prie parudi utowo count and your parentemente a motion pero naprawit sapien New) ** Ne of Natue of Plan Maich them with the strength and for schouding Capital Budgeting models Strength and weaknesses is based on cash can be used to assess precabaty, and take into account the time value of money is one of the weaknesses of the other he models Now compute the ARR (accounting rate of noturn) for both plane (Round the percentages to the newest tenth sercent) Plan A Plana est compute the NPV put pensent value) under each dian. Begin with Plan A then compute Pan B. (Round your answers to the mornet whole dote and in partes e amie en representare PV) Nel proof Plan Net proof Plan Mathe term with the strength and weaknesses for each of the three bugeing models Strengths and weaknesses Capital budgeting modele Is based on cash flow, can be used to assess profitability, and take into account the time value of money. It has none of the weaknesses of the other two models is easy to understand, is based on a rows, and highlights risks. However, it Ignores profitability and the time value of money Can be used to profitability, but it ignore the time value of money Requirement 2 Wideronson should Jo Jo choose Why? Recoration est in as the netrust. It has a payback period Requirement. Estimah PanAIRR How does the IRR compare with the company recuired from? The Romal rate of return of Plan Ais butween the company's hurde rate of 6% Requirement 1. Compute the payback period, the ARR, and the NPV of these two plans. What are the strengths and weaknesses of these capital budgeting models? Begin by computing the payback period for both plans. (Round your answers to one decimal place) Plan A (In years) Plan B (in years) Now compute the ARR (accounting rate of return) for both plans (Round the percentagen to the nearest tenth percent.) Plan A Plan B Next compute the NPV (net present value) under each plan. Begin with Plan A, then compute Plan B. (Round your answers to the nearest whole dollar and uso, parentheses or a minus sign to represent a negative NPV) Net present value of Plan A Not prosent value of Plan B Match the term with the strengths and weaknesses listed for each of the three capital budgeting models, Capital budgeting models Strengths and weaknesses is based on cash flows, can be used to assess profitability, and takes into account Net present value of Plan A Net present value of Plan B Match the term with the strengths and weaknesses listed for each of the three capital budgeting models Strengths and woaknesses Capital budgeting models Is based on cash flows, can be used to assess profitability, and takes into account the time value of money. It has none of the weaknesses of the other two models is easy to understand, is based on cash flows, and highlights risks. However, it Ignores profitability and the time value of money, Can be used to assess profitability, but it ignores the time value of money. Requirement 2. Which expansion plan should My Bean choose? Why? Recommendation: Invest in It has the net present value. It also has a payback period Requirement 3. Estimate Plan A's IRR. How does the IRR compare with the company's required rate of retum? The IRR (internal rate of return) of Plan A is between This rate the company's hurdle rate of 6%. - Reference Present Value of Annuity of $1 Periods 1% 2% 3% 4% 5% 6% 8% 10% 12% 14% 16% 18% 20% Period 1 0.990 0.980 0.971 0.962 0.952 0.943 0.926 0.909 0.893 0.877 0.862 0.847 0.833 Period 2 1.970 1.942 1.913 1.886 1.859 1.833 1.783 1.736 1.690 1.647 1.605 1.566 1.528 Period 3 2.9412.884 2.829 2.775 2.723 2.673 2.577 2.487 2.402 2.322 2.246 2.174 2.106 Period 4 3.902 3.808 3.717 3.630 3.546 3.465 3.312 3.170 3.037 2.914 2.798 2.690 2.589 Period 5 4.853 4.713 4.580 4.452 4.329 4.2123.993 3.791 3.605 3.433 3.274 3.127 2.991 Period 6 5.795 5.601 5.417 5.242 5.076 4.917 4.623 4.355 4.111 3.889 3.685 3.498 3.326 Period 7 6.728 6.472 6.230 6.002 5.786 5.5825.206 4.8684.564 4.288 4.039 3.812 3.605 Period 8 7.652 7.325 7.020 6.733 6.463 6.210 5.747 5.335 4.968 4.639 4.344 4.078 3.837 Period 9 8.566 8.1627.786 7.435 7.108 6.802 6.247 5.759 5.328 4.946 4.607 4.303 4.031 Period 10 9.471 8.983 8.530 8.111 7.722 7.360 6.710 6.145 5.650 5.216 4.833 4.494 4.192 Period 11 10.368 9.787 9.253 8.760 8.306 7.887 7.139 6.495 5.938 5.453 5.029 4.656 4.327 Period 12 11.255 10.575 9.954 9.385 8.863 8.384 7.536 6.814 6.194 5.660 5.197 4.793 4.439 Period 13 12.134 11.348 10.635 9.986 9.394 8.853 7.904 7.103 6.424 5.842 5.342 4.910 4.533 Period 14 13.004 12.106 11.296 10.563 9.899 9.295 8.244 7.367 | 6.628 6.002 5.468 5.008 4.611 Period 15 13.865 12.849 11.938 11.118 10.380 9.712 8.559 7.606 6.811 6.142 5.575 5.092 4.675 Period 20 18.046 16.351 14.877 13.590 12.462 11.470 9.818 8.5147.469 6.623 5.929 5.353 4.870 Period 25 22.023 19.523 17.413 15.622 14.094 12.783 10.675 9.077 7.8436.873 6.097 5.467 4.948 Period 30 25.808 22.396 19.600 17.292 15.372 13.765 11.258 9.427 8.055 7.003 6.177 5.517 4.979 Period 40 32.835 27.355 23.115 19.793 17.159 15.046 11.925 9.7798.244 7.105 6.233 5.548 4.997 Reference Future Value of Annuity of $1 Periods 1% 2% 3% 4% 5% 6% 8% 10% 12% 14% 16% 18% 20% Period 1 1.000 1.000 1.000 1.000 1.000 1.000 1.000 1.000 1.000 1.000 1.000 1.000 1.000 Period 2 2.010 2.020 2.030 2.040 2.050 2.060 2.080 2.100 2.120 2.140 2.160 2.180 2.200 Period 3 3.030 3.060 3.091 3.122 3.153 3.184 3.246 3.310 3.374 3.440 3.506 3.572 3.640 Period 4 4.060 4.122 4.184 4.246 4.310 4.375 4.506 4.641 4.779 4.921 5.066 5.215 5.368 Period 5 5.101 5.204 5.309 5.416 5.526 5.637 5.867 6.105 6.353 6.610 6.877 7.154 7.442 Period 6 6.152 6.308 6.468 6.633 6.802 6.975 7.336 7.716 8.115 8.536 8.977 9.442 9.930 Period 7 7.214 7.434 7.662 7.898 8.142 8.394 8.923 9.487 10.089 10.730 11.414 12.142 12.916 Period 8 8.286 8.583 8.892 9.214 9.549 9.897 10.637 11.436 12.300 13.233 14.240 15,327 16.499 Period 9 9.369 9.755 10.159 10.583 11.027 11.491 12.488 13.579 14.776 16.085 17.519 19.086 20.799 Period 10 10.462 10.950 11.464 12.006 12.578 13.181 14.487 15.937 17.549 19.337 21.321 23.521 25.959 Period 11 11.567 12.169 12.808 13.486 14.207 14.972 16.645 18.531 20.655 23.045 25.733 28.755 32.150 Period 12 12.683 13.412 14.192 15.026 15.917 16.870 18.977 21.384 24.133 27.271 30.850 34.931 39.581 Period 13 13.809 14.680 15.618 16.627 17.713 18.882 21.495 24.523 28.029 32.089 36.786 42.219 48.497 Period 14 14.947 15.974 17.086 18.292 19.599 21.015 24.215 27.975 32.393 37.581 43.672 50.818 59.196 Period 15 16.097 17.293 18.599 20.024 21.579 23.276 27.152 31.772 37.280 43.842 51.660 60.965 72.035 Period 20 22.019 24.297 26.870 29.778 33,066 36.786 45.762 57.275 72.052 91.025 115.380 146.628 186.688 Period 25 28.243 32.030 36.459 41.646 47.727 54.865 73.106 98.347 133.334 181.871 249.214 342.603 471.981 Period 30 34.785 40.568 47.575 56.085 66.439 79.058 113.283 164.494 241.333 356.787 530.312 790.948 1,181.882 Period 40 48.886 60.402 75.401 95.026 120.800 154.762 259.057 442.593 767.091 1,342.025 2,360.757 4.163.213 7.343.858 Print Done Reference Present Value of $1 Periods 1% 2% 3% 4% 5% 6% 8% 10% 12% 14% 16% 18% 20% Period 1 0.990 0.980 0.971 0.962 0.952 0.943 0.926 0.9090.893 0.877 0.862 0.847 0.833 Period 2 0.980 0.961 0.943 0.925 0.907 0.890 0.857 0.826 0.797 0.769 0.743 0.7180.694 Period 3 0.971 0.942 0.915 0.889 0.864 0.840 0.794 0.751 0.712 0.675 0.641 0.609 0.579 Period 4 0.961 0.924 0.888 0.855 0.823 0.792 0.735 0.683 0.636 0.592 0.552 0.516 0.482 Period 5 0.951 0.906 0.863 0.822 0.784 0.747 0.681 0.621 0.567 0.519 0.476 0.437 0.402 Period 6 0.942 0.888 0.837 0.790 0.746 0.705 0.630 0.564 0.507 0.456 0.410 0.370 0.335 Period 7 0.933 0.871 0.813 0.760 0.711 0.665 0.583 0.513 0.452 0.400 0.354 0.314 0.279 Period 8 0.923 0.853 0.789 0.731 0.677 0.627 0.540 0.467 0.404 0.351 0.305 0.266 0.233 Period 9 0.914 0.837 0.766 0.703 0.6450.592 0.500 0.424 0.361 0.308 0.263 0.225 0.194 Period 10 0.905 0.820 0.744 0.676 0.614 0.558 0.463 0.386 0.322 0.270 0.227 0.191 0.162 Period 11 0.896 0.804 0.722 0.650 0.585 0.527 0.429 0.350 0.287 0.237 0.195 0.162 0.135 Period 12 0.887 0.788 0.701 0.625 0.557 0.497 0.397 0.319 0.257 0.208 0.168 0.137 0.112 Period 13 0.879 0.773 0.681 0.601 0.530 0.469 0.368 0.290 0.229 0.182 0.145 0.116 0.093 Period 14 0.870 0.758 0.661 0.577 0.505 0.442 0.340 0.263 0.205 0.160 0.125 0.099 0.078 Period 15 0.861 0.743 0.642 0.555 0.481 0.417 0.315 0.239 0.183 0.140 0.108 0.084 0.065 Period 20 0.820 0.673 0.554 0.456 0.377 0.312 0.215 0.149 0.104 0.073 0.051 0.037 0.026 Period 25 0.780 0.610 0.478 0.375 0.295 0.233 0.146 0.092 0.059 0.038 0.024 0.016 0.010 Period 30 0.742 0.552 0.412 0.308 0.231 0.174 0.099 0.057 0.033 0.020 0.012 0.007 0.004 Period 40 0.672 0.453 0.307 0.208 0.142 0.097 0.046 0.022 0.011 0.005 0.003 0.001 0.001 Reference 1% 1.010 1.020 1.030 1.041 1.051 1.062 1.072 1.083 1.094 1.105 2% 1.020 1.040 1.061 1.082 1.104 3% 1.030 1.061 1.093 1.126 1.159 4% 1.040 1.082 1.125 1.170 1.217 5% 1.050 1.103 1.158 1.216 1.276 Future Value of $1 6% 8% 1.060 1.080 1.124 1.166 1.191 1.260 1.262 1.360 1.338 1.469 10% 1.100 1.210 1.331 1.464 1.611 1.772 1.949 2.144 2.358 2.594 12% 1.120 1.254 1.405 1.574 1.762 Periods Period 1 Period 2 Period 3 Period 4 Period 5 Period 6 Period 7 Period 8 Period 9 Period 10 Period 11 Period 12 Period 13 Period 14 Period 15 Period 20 Period 25 Period 30 Period 40 14% 1.140 1.300 1.482 1.689 1.925 2.195 2.502 2.853 3.252 3.707 16% 1.160 1.346 1.561 1.811 2.100 18% 1.180 1.392 1.643 1.939 2.288 20% 1.200 1.440 1.728 2.074 2.488 1.126 1.149 1.172 1.195 1.219 1.194 1.230 1.267 1.305 1.344 1.265 1.316 1.369 1.423 1.480 1.340 1.407 1.477 1.551 1.629 1.419 1.504 1.594 1.689 1.791 1.587 1.714 1.851 1.999 2.159 1.974 2.211 2.476 2.773 3.106 2.436 2.826 3.278 3.803 4.411 2.700 3.185 3.759 4.435 5.234 2.986 3.583 4.300 5.160 6.192 1.116 1.127 1.138 1.149 1.161 1.243 1.268 1.294 1.319 1.346 1.384 1.426 1.469 1.513 1.558 1.539 1.601 1.665 1.732 1.801 1.710 1.796 1.886 1.980 2.079 1.898 2.012 2.133 2.261 2.397 2.332 2.518 2.720 2.937 3.172 2.853 3.138 3.452 3.797 4.177 3.479 3.896 4.363 4.887 5.474 4.226 4.818 5.492 6.261 7.138 5.117 5.936 6.886 7.988 9.266 6.176 7.288 8.599 10.147 11.974 7.430 8.916 10.699 12.839 15.407 1.220 1.282 1.348 1.489 1.486 1.641 1.811 2.208 1.806 2.094 2.427 3.262 2.191 2.666 3.243 4.801 2.653 3.386 4.322 7.040 3.207 4.661 6.727 9.646 13.743 19.461 27.393 38.338 4.292 6.848 10.835 17.000 26.462 40.874 62.669 95.396 5.743 10.063 17.449 29.960 50.950 85.850 143.371 237.376 10.286 21.725 45.259 93.051 188.884 378.721 750.378 1.469.772 1. Compute the payback period, the ARR, and the NPV of these two plans. What are the strengths and weaknesses of these capital budgeting models? 2. Which expansion plan should Jo Jo choose? Why? 3. Estimate Plan A's IRR. How does the IRR compare with the company's required rate of return? Join the the coming to be a would water cost of $850.000 Expected to the wat end of the Part would come out of 18.240.000 This is et ca 350.000 per year for tenyered 5926000 60 in depreciation of Com vow the Requrumune 1, comune sy bers, WARR. and we are o pure what are the strengere and was the couple budgeting room? Begin by cong the payback period for both plans for your ow) Pyears Plannya www.comun AHR securing my brom pune Montepercentage of a percent) Plan Plan Hient compare to Mpy met persent vale under each pila Bogowe Para han compita Pian . plound your andre so prie parudi utowo count and your parentemente a motion pero naprawit sapien New) ** Ne of Natue of Plan Maich them with the strength and for schouding Capital Budgeting models Strength and weaknesses is based on cash can be used to assess precabaty, and take into account the time value of money is one of the weaknesses of the other he models Now compute the ARR (accounting rate of noturn) for both plane (Round the percentages to the newest tenth sercent) Plan A Plana est compute the NPV put pensent value) under each dian. Begin with Plan A then compute Pan B. (Round your answers to the mornet whole dote and in partes e amie en representare PV) Nel proof Plan Net proof Plan Mathe term with the strength and weaknesses for each of the three bugeing models Strengths and weaknesses Capital budgeting modele Is based on cash flow, can be used to assess profitability, and take into account the time value of money. It has none of the weaknesses of the other two models is easy to understand, is based on a rows, and highlights risks. However, it Ignores profitability and the time value of money Can be used to profitability, but it ignore the time value of money Requirement 2 Wideronson should Jo Jo choose Why? Recoration est in as the netrust. It has a payback period Requirement. Estimah PanAIRR How does the IRR compare with the company recuired from? The Romal rate of return of Plan Ais butween the company's hurde rate of 6% Requirement 1. Compute the payback period, the ARR, and the NPV of these two plans. What are the strengths and weaknesses of these capital budgeting models? Begin by computing the payback period for both plans. (Round your answers to one decimal place) Plan A (In years) Plan B (in years) Now compute the ARR (accounting rate of return) for both plans (Round the percentagen to the nearest tenth percent.) Plan A Plan B Next compute the NPV (net present value) under each plan. Begin with Plan A, then compute Plan B. (Round your answers to the nearest whole dollar and uso, parentheses or a minus sign to represent a negative NPV) Net present value of Plan A Not prosent value of Plan B Match the term with the strengths and weaknesses listed for each of the three capital budgeting models, Capital budgeting models Strengths and weaknesses is based on cash flows, can be used to assess profitability, and takes into account Net present value of Plan A Net present value of Plan B Match the term with the strengths and weaknesses listed for each of the three capital budgeting models Strengths and woaknesses Capital budgeting models Is based on cash flows, can be used to assess profitability, and takes into account the time value of money. It has none of the weaknesses of the other two models is easy to understand, is based on cash flows, and highlights risks. However, it Ignores profitability and the time value of money, Can be used to assess profitability, but it ignores the time value of money. Requirement 2. Which expansion plan should My Bean choose? Why? Recommendation: Invest in It has the net present value. It also has a payback period Requirement 3. Estimate Plan A's IRR. How does the IRR compare with the company's required rate of retum? The IRR (internal rate of return) of Plan A is between This rate the company's hurdle rate of 6%
Step by Step Solution
There are 3 Steps involved in it

Get step-by-step solutions from verified subject matter experts