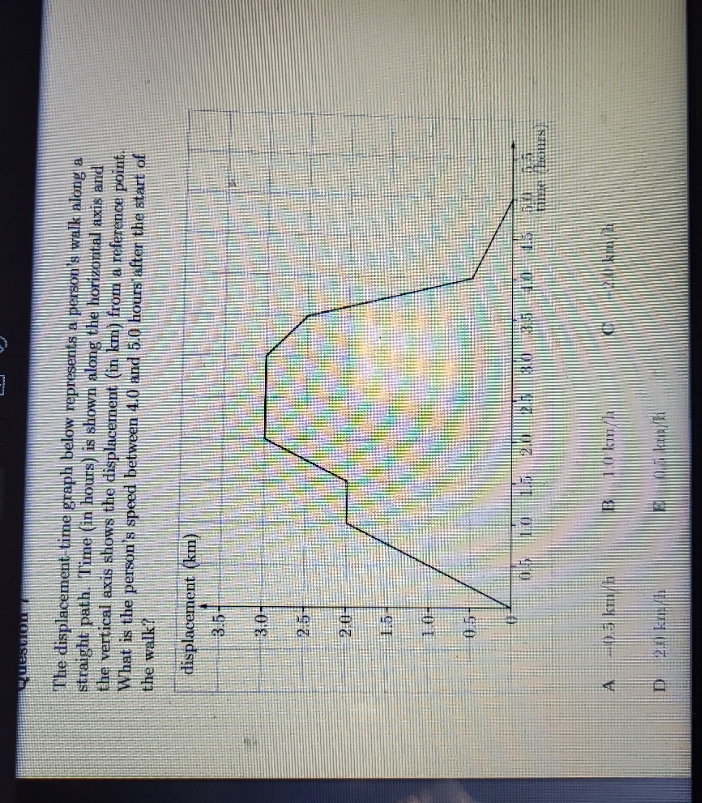
Question: no extra detail The displacement time graph below represents a person's walk along a straight path. Time (in hours) is shown along the horizontal axis

no extra detail

no extra detail The displacement time graph below
The displacement time graph below represents a person's walk along a straight path. Time (in hours) is shown along the horizontal axis and the vertical axis shows the displacement (in km) from a reference point What is the person's speed between 4.0) and 5.0 hours after the start of the walk? displacement (km) 3.5- Tinge hanes

Step by Step Solution

There are 3 Steps involved in it

1 Expert Approved Answer
Step: 1 Unlock blur-text-image
Question Has Been Solved by an Expert!

Get step-by-step solutions from verified subject matter experts

Step: 2 Unlock
Step: 3 Unlock

Students Have Also Explored These Related Mathematics Questions!