Question: NO idea where to start from would you please help? OBJECTIVE Relationships between Security Return, Beta, Risks and Financial Ratio of a company assigned to
NO idea where to start from would you please help?
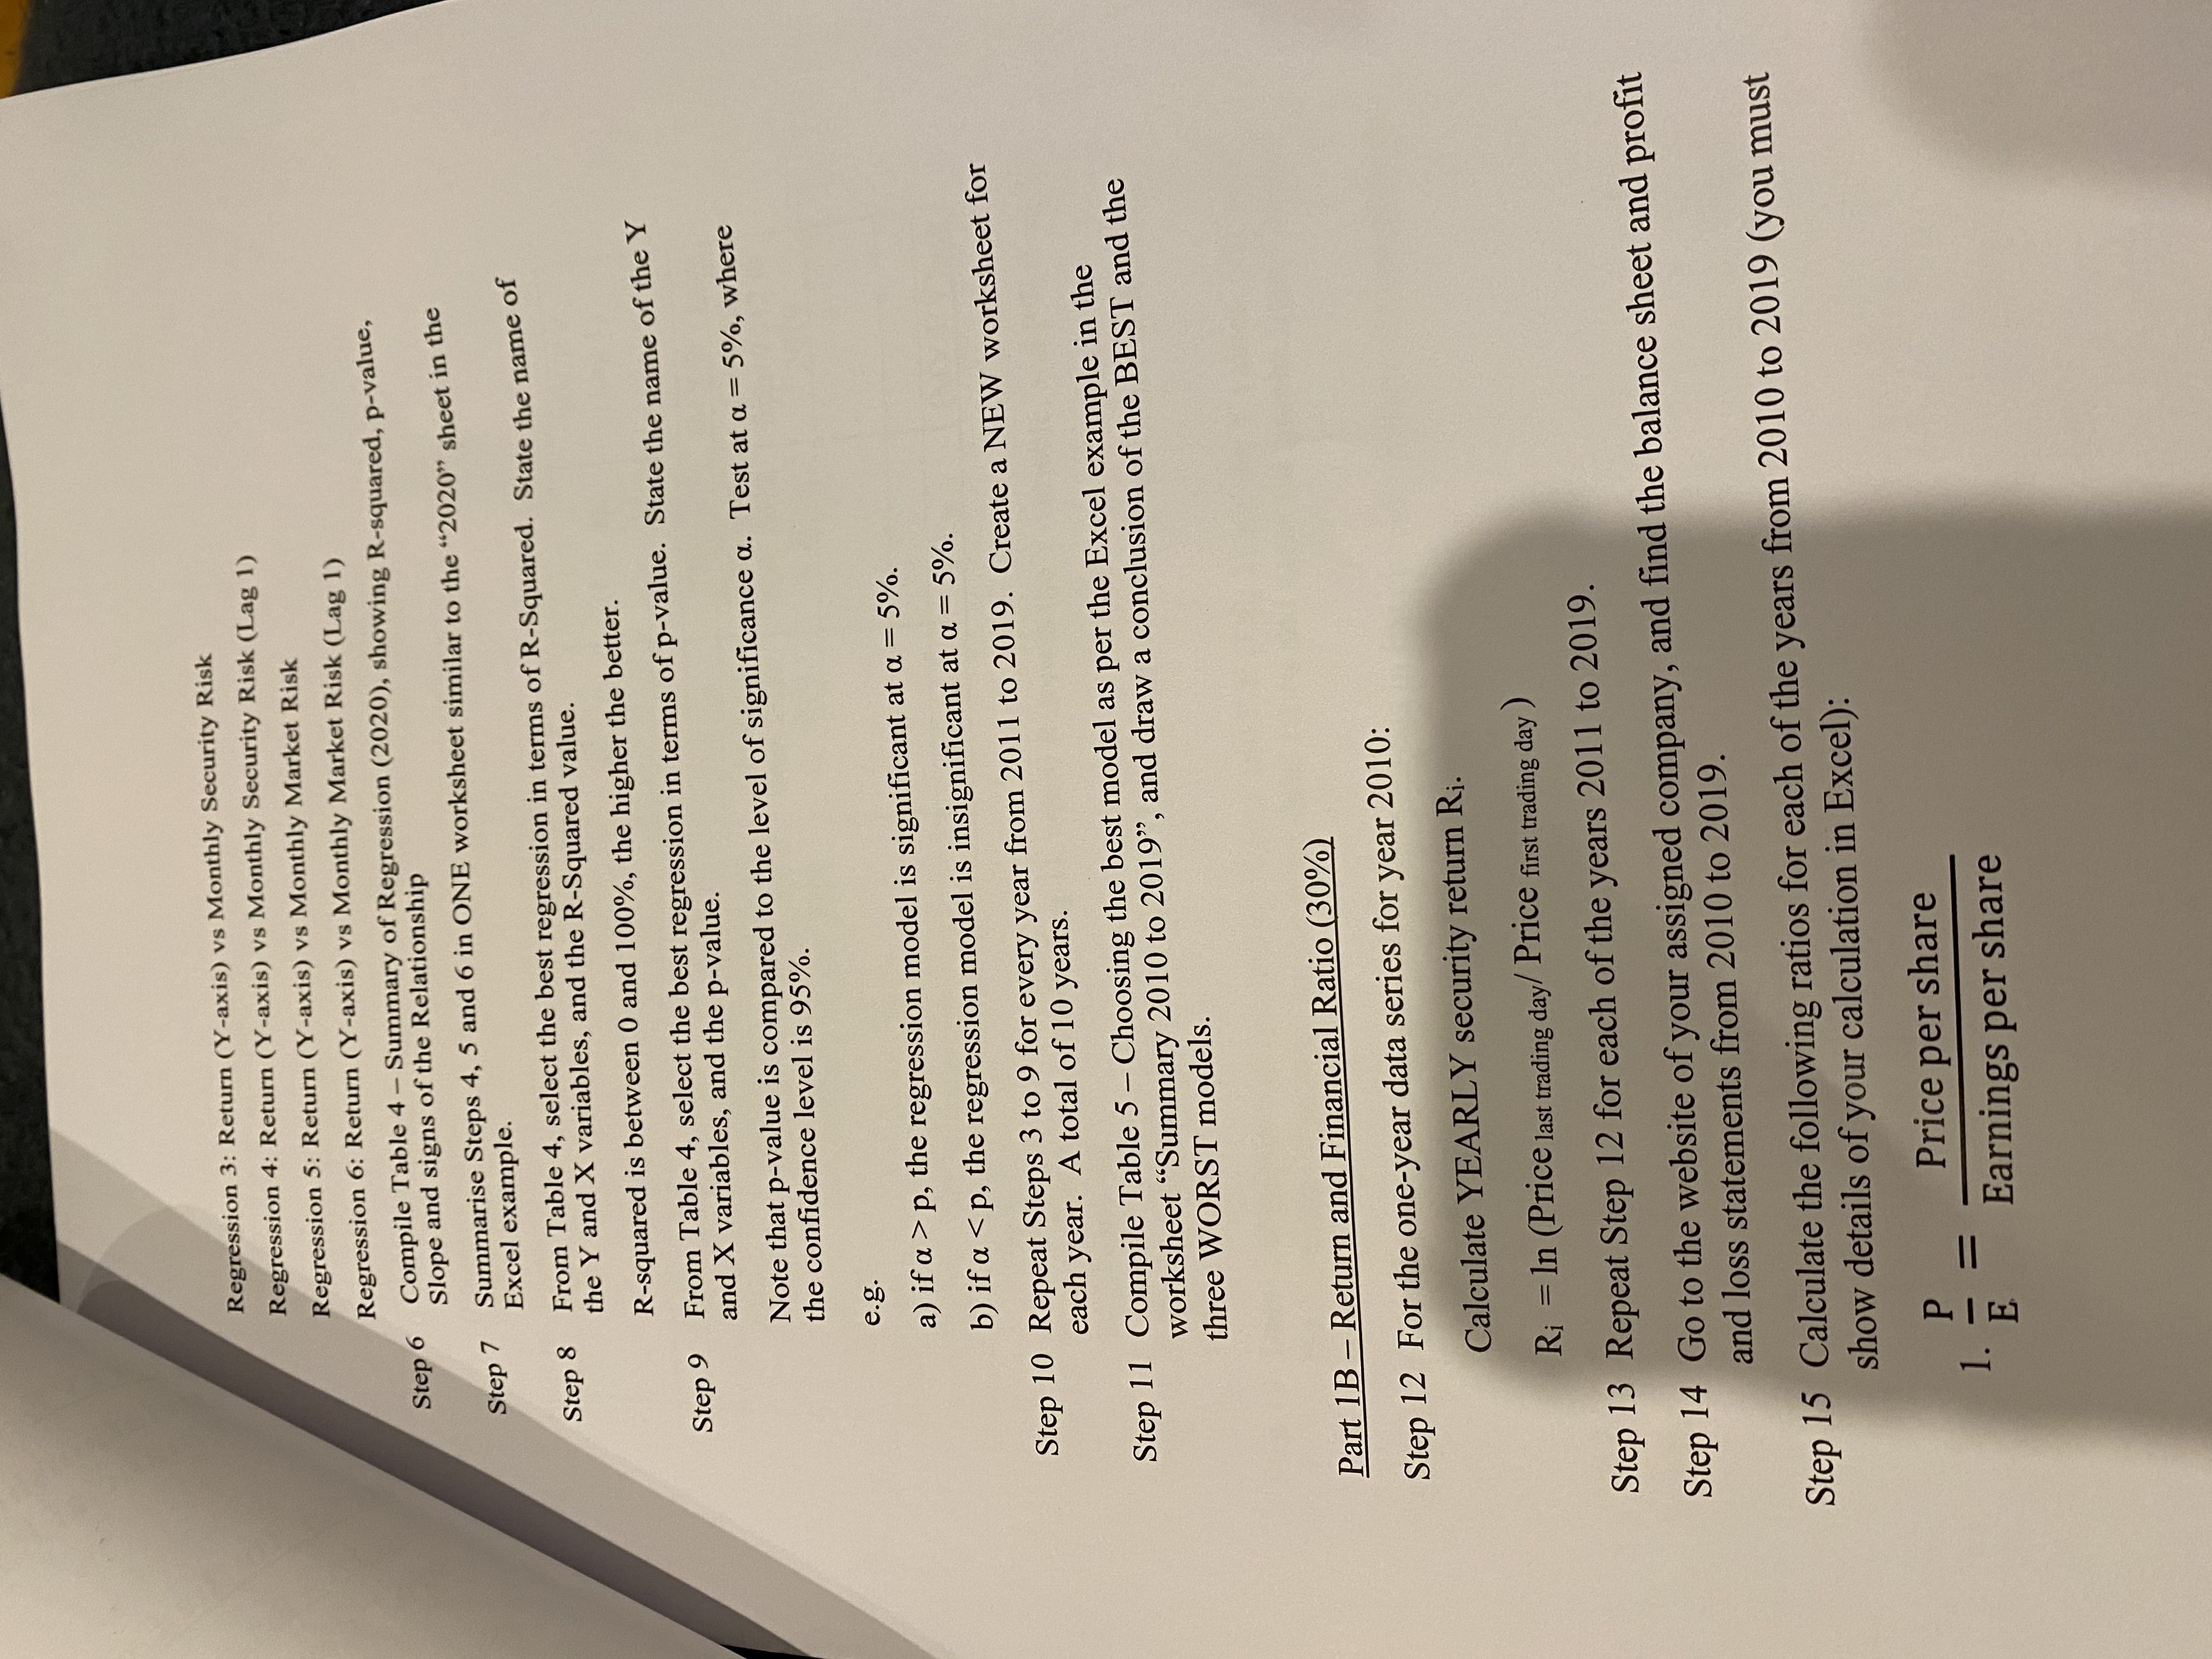
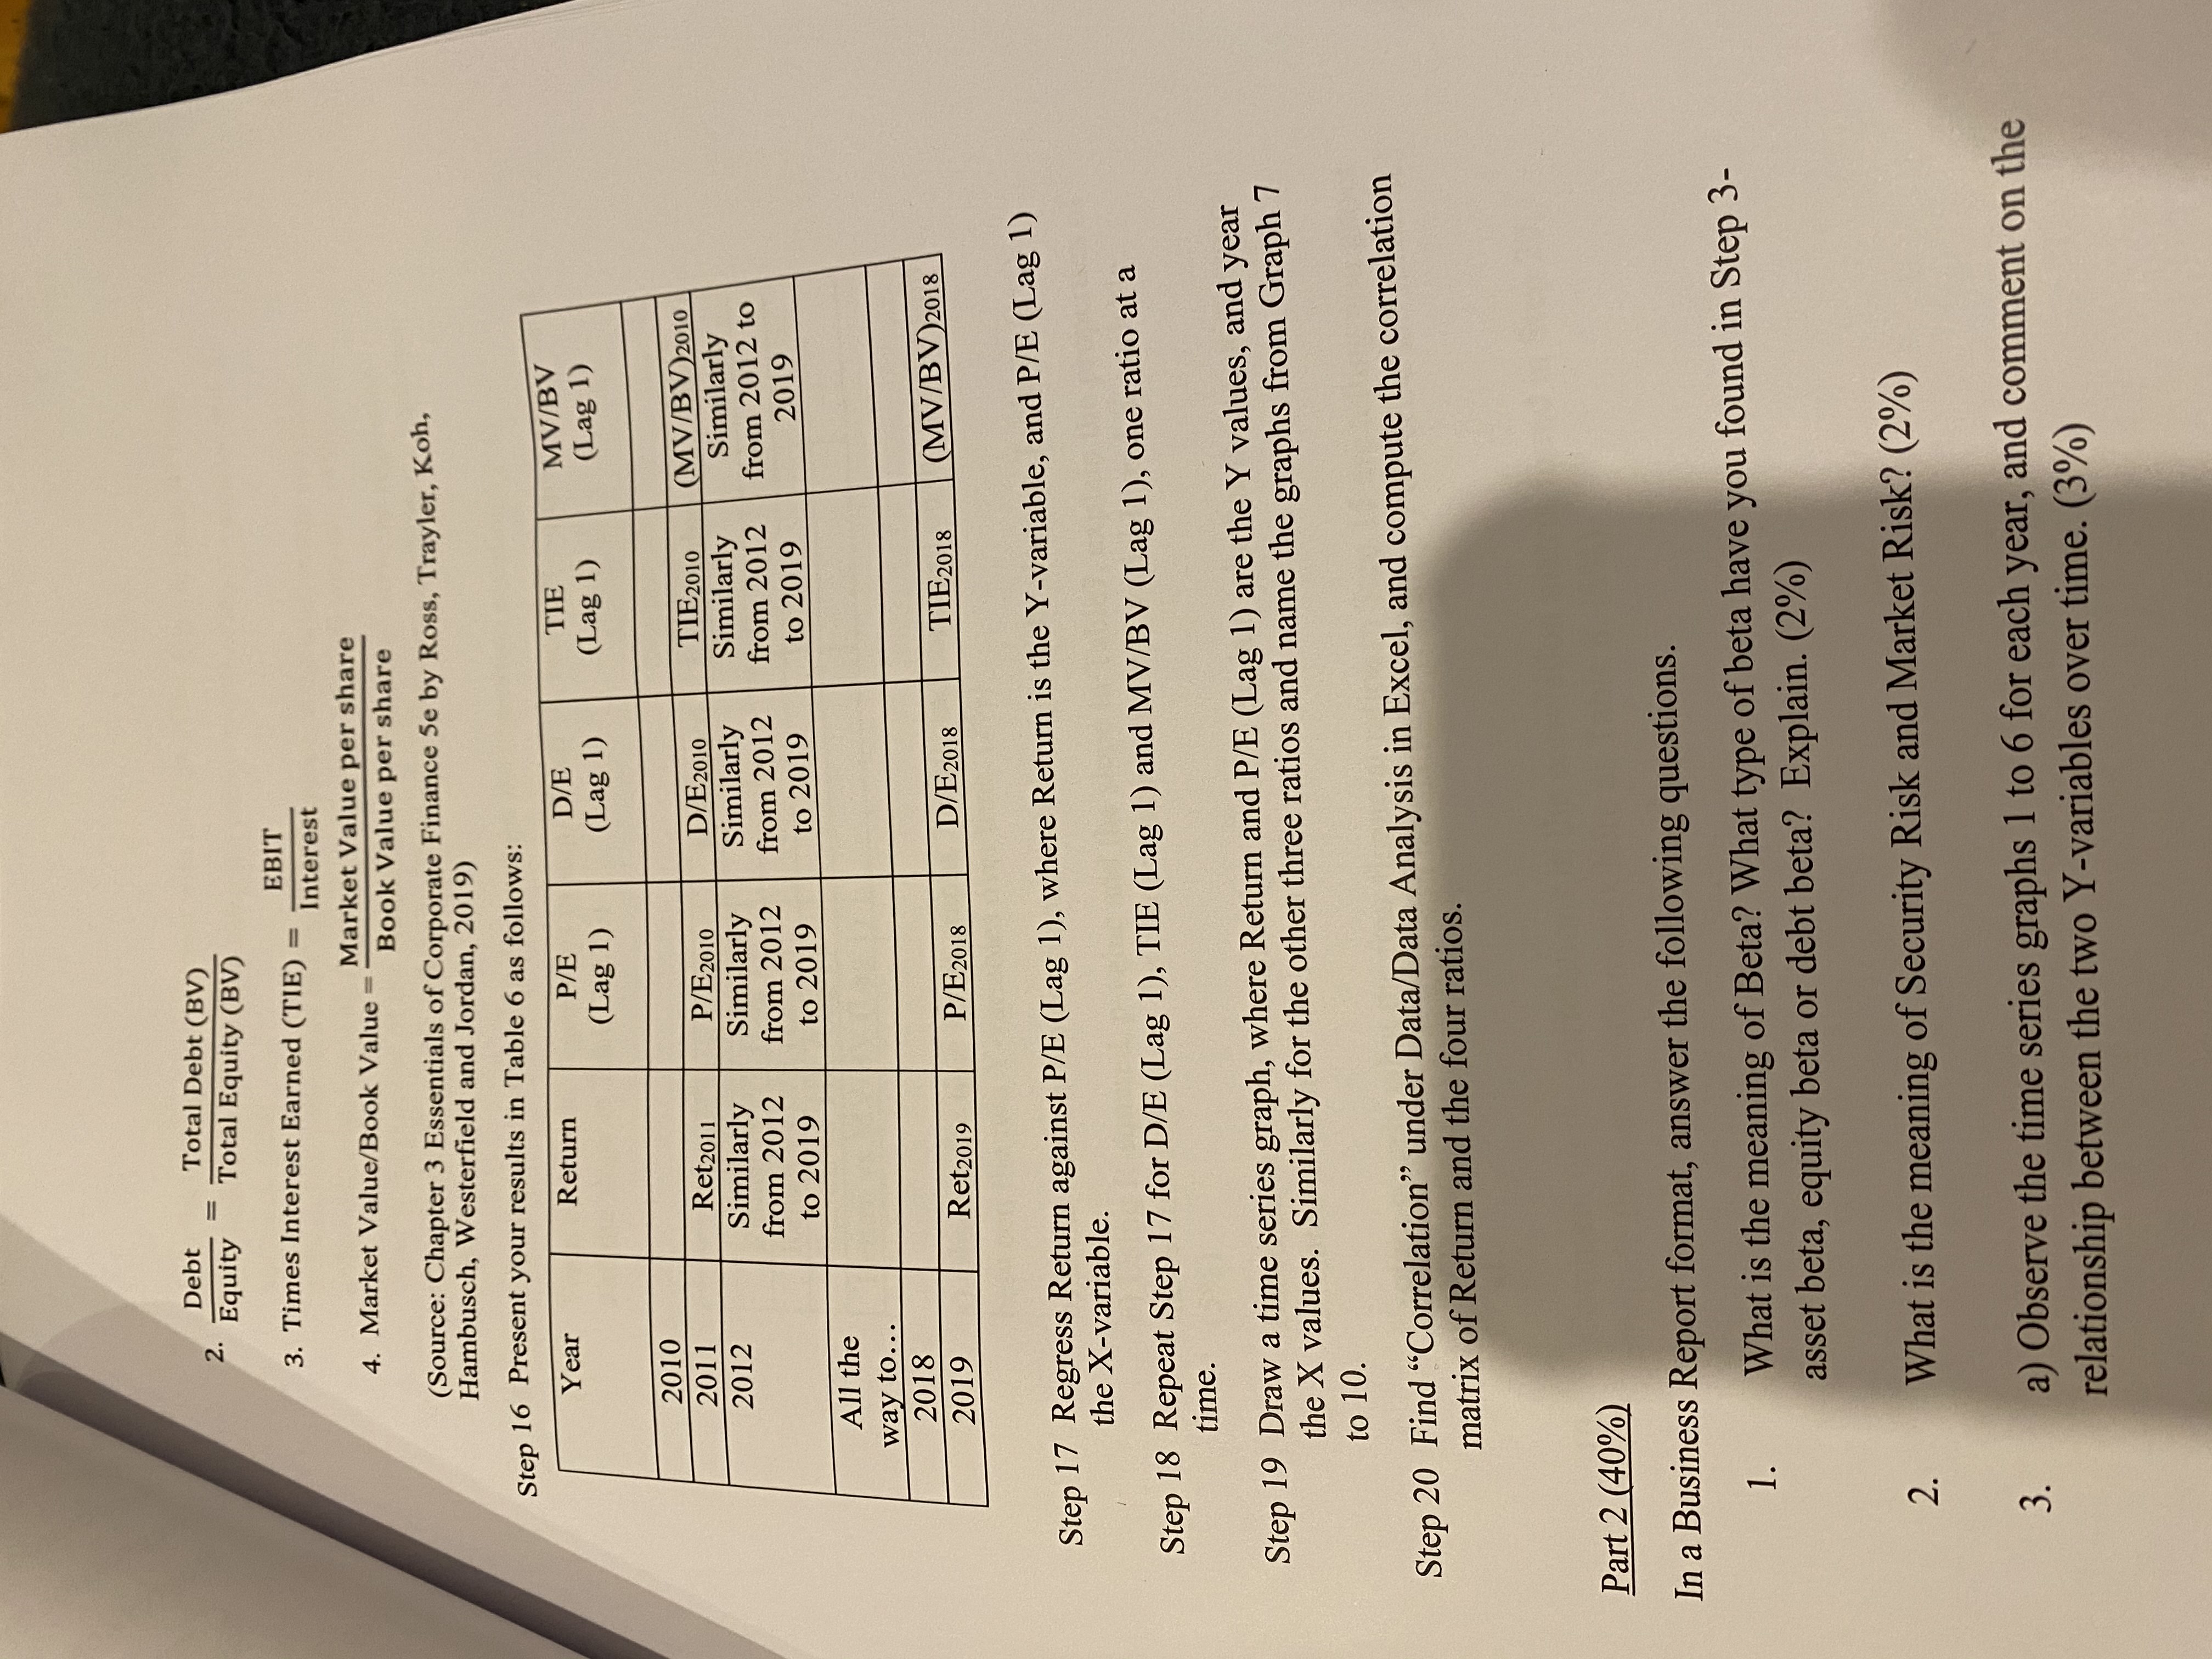
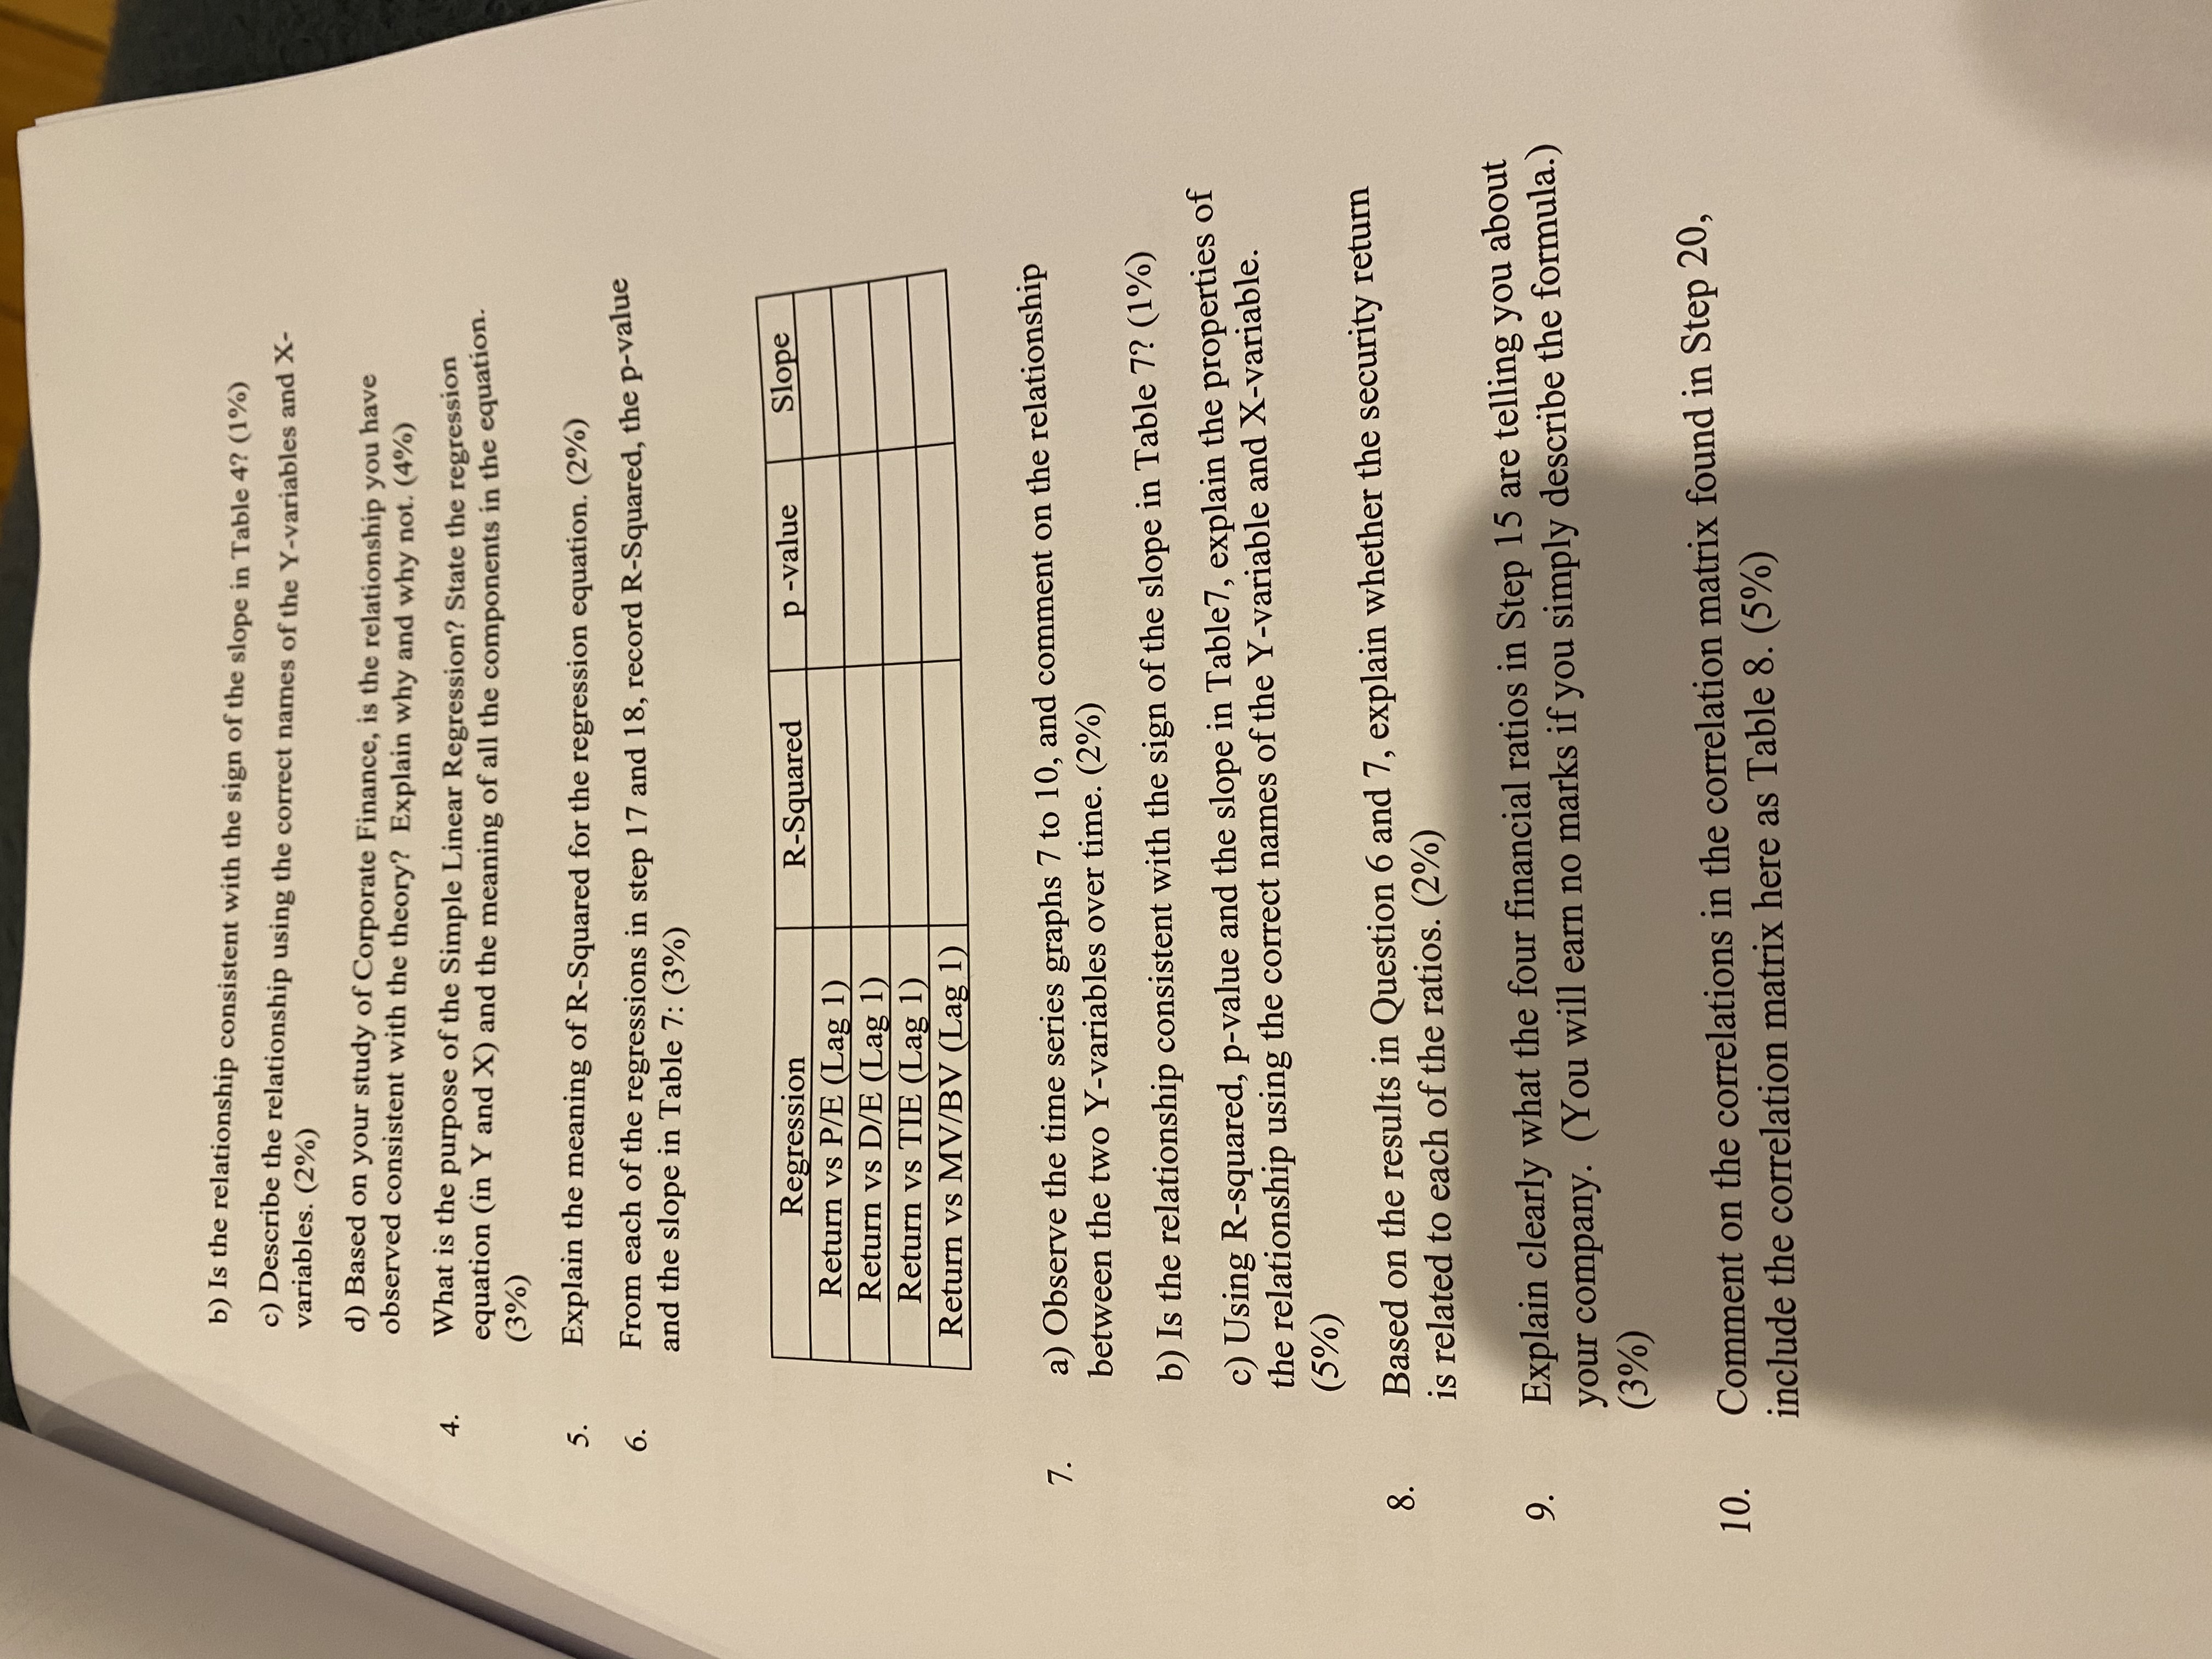
OBJECTIVE Relationships between Security Return, Beta, Risks and Financial Ratio of a company assigned to your group Refer to the Excel Example and Word Explanation in Moodle Part 1A - Return and Risk (30%) Step 1 Collect 10 years (1-1-2010 to 31-12-2019) of DAILY closing price data for your company from https://au.finance.yahoo.com Step 2 Collect 10 years of All Ordinaries Index ("AORD) ) DAILY closing index from the same site. Step 3 For the one-year data series for year 2010: 3a) Calculate DAILY security return Ri. Ri = In (Price t + 1 / Price :) 3b) Calculate DAILY market return Rm. Rm = In (AORD + + 1 /AORD () 3c) Calculate MONTHLY Return, Security Risk and Market Risk 3d) Compile THREE Tables similar to that shown in the "Combined" sheet in the Excel example: Table 1: Monthly Return, Monthly Beta, Monthly Beta (Lag 1) Table 2: Monthly Return, Monthly Security Risk, Monthly Security Risk (Lag 1) Table 3: Monthly Return, Monthly Market Risk, Monthly Market Risk (Lag 1) Step 4 For the one-year data series for year 2010 (refer to the "2010" sheet in the Excel example. The graphs must use the right scales for comparison. Use Primary and Secondary axes if necessary) Plot SIX time series graphs of: Graph 1: Return and Monthly Beta vs time Graph 2: Return and Monthly Beta (Lag 1) vs time Graph 3: Return and Monthly Security Risk vs time Graph 4: Return and Monthly Security Risk (Lag 1) vs time Graph 5: Return and Monthly Market Risk vs time Graph 6: Return and Monthly Market Risk (Lag 1) vs time Step 5 For the one-year data series for year 2010: Carry out SIX Regressions of: Regression 1: Return (Y-axis) vs Monthly Beta Regression 2: Return (Y-axis) vs Monthly Beta (Lag 1)Regression 3: Return (Y-axis) vs Monthly Security Risk Regression 4: Return (Y-axis) vs Monthly Security Risk (Lag 1) Regression 5: Return (Y-axis) vs Monthly Market Risk Regression 6: Return (Y-axis) vs Monthly Market Risk (Lag 1) Step 6 Compile Table 4 - Summary of Regression (2020), showing R-squared, p-value, Slope and signs of the Relationship Step 7 Summarise Steps 4, 5 and 6 in ONE worksheet similar to the "2020" sheet in the Excel example. Step 8 From Table 4, select the best regression in terms of R-Squared. State the name of the Y and X variables, and the R-Squared value. R-squared is between 0 and 100%, the higher the better. Step 9 From Table 4, select the best regression in terms of p-value. State the name of the Y and X variables, and the p-value. Note that p-value is compared to the level of significance a. Test at a = 5%, where the confidence level is 95%. e.g. a) if a > p, the regression model is significant at a = 5%. b) if a