

Question: no need to plot the date, i need the steps to each one Twelve samples, each containing five parts, were taken from a process that
no need to plot the date, i need the steps to each one 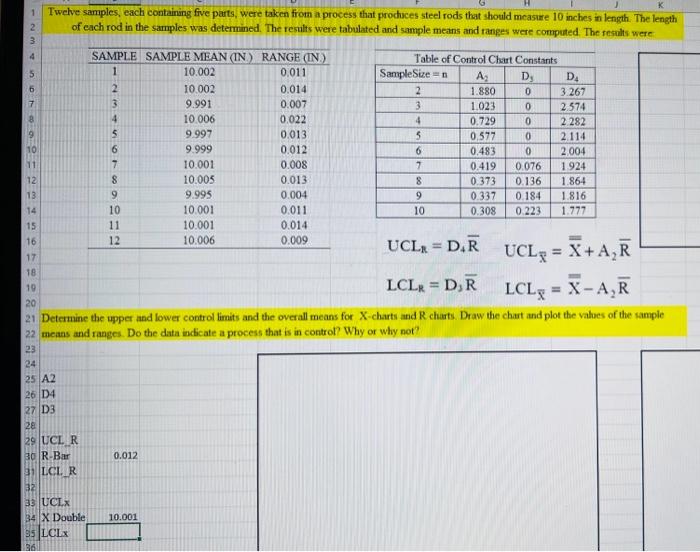
Twelve samples, each containing five parts, were taken from a process that prochuces steel rods that should measure 10 inches in leagth. The length of each rod in the samples was determined. The results were tabulated and sample means and ranges were computed. The results were UCLR=D4RUCLX=X+A2R LCLR=D3R LCLX=XA2R Determine the upper and lower control limits and the overall means for X-charts and R charts. Draw the chart and plot the values of the sample meass and raages. Do the data indicate a process that is in control? Why or why not
Step by Step Solution
There are 3 Steps involved in it
1 Expert Approved Answer
Step: 1 Unlock

Question Has Been Solved by an Expert!
Get step-by-step solutions from verified subject matter experts
Step: 2 Unlock
Step: 3 Unlock