Question: Refer to Table 56.1 - Factors for Computing Control Chart Limits (3 sigma) for this problem. Twelve samples, each containing five parts, were taken from
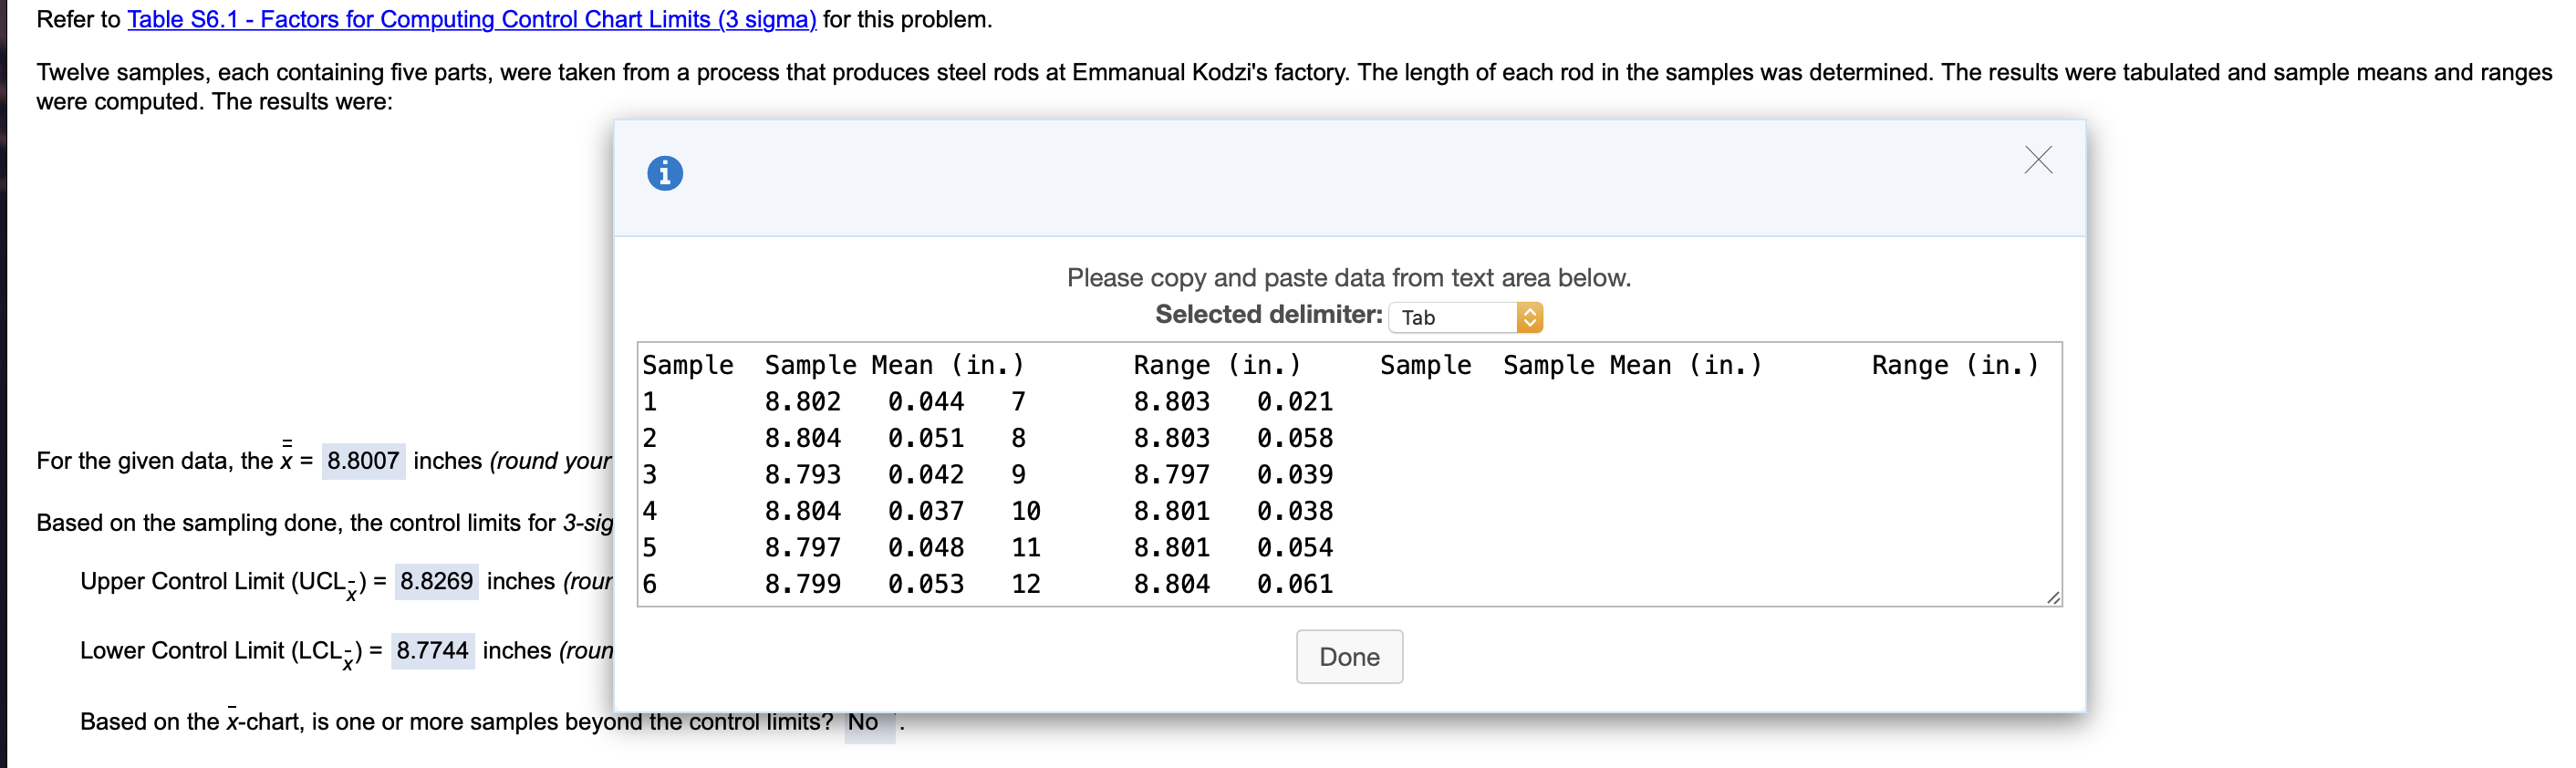
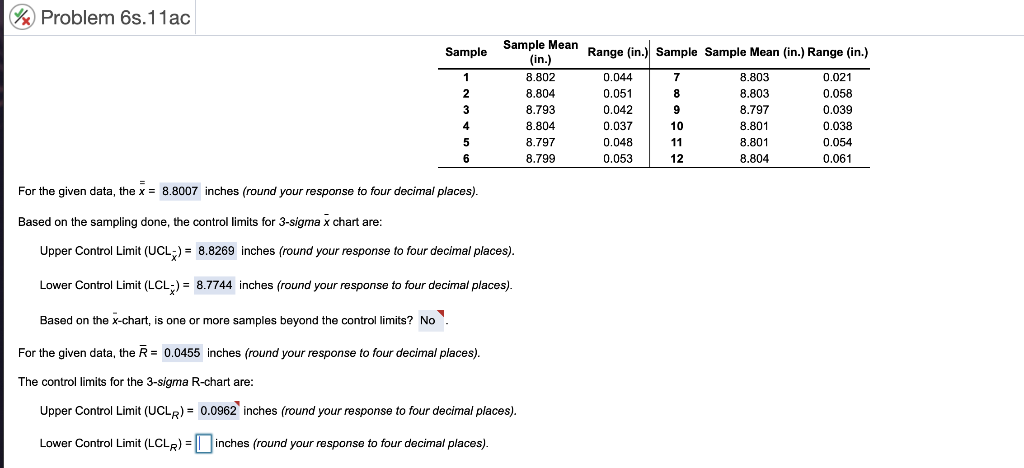
Refer to Table 56.1 - Factors for Computing Control Chart Limits (3 sigma) for this problem. Twelve samples, each containing five parts, were taken from a process that produces steel rods at Emmanual Kodzi's factory. The length of each rod in the samples was determined. The results were tabulated and sample means and ranges were computed. The results were: i X Range (in.) Sample Sample Mean (in.) 1 8.802 0.044 7 2 8.804 0.051 8 For the given data, the x = 8.8007 inches (round your 3 8.793 0.042 9 4 8.804 0.037 10 Based on the sampling done, the control limits for 3-sig 5 8.797 0.048 11 Upper Control Limit (UCL3) = 8.8269 inches (rour 6 8.799 0.053 12 Please copy and paste data from text area below. Selected delimiter: Tab Range (in.) Sample Sample Mean (in.) 8.803 0.021 8.803 0.058 8.797 0.039 8.801 0.038 8.801 0.054 8.804 0.061 Lower Control Limit (LCL2) = 8.7744 inches (roun Done Based on the x-chart, is one or more samples beyond the control limits? No Problem 6s.11ac Sample Range (in.) Sample Sample Mean (in.) Range (in.) 1 2 3 Sample Mean (in.) 8.802 8.804 8.793 8.804 8.797 8.799 0.044 0.051 0.042 0.037 0.048 0.053 7 8 9 10 8.803 8.803 8.797 8.801 8.801 8.804 0.021 0.058 0.039 0.038 0.054 0.061 4 5 6 12 For the given data, the x = 8.8007 inches (round your response to four decimal places). Based on the sampling done, the control limits for 3-sigma x chart are: Upper Control Limit (UCL;) = 8.8269 inches (round your response to four decimal places). Lower Control Limit (LCL;) = 8.7744 inches (round your response to four decimal places). Based on the x-chart, is one or more samples beyond the control limits? No For the given data, the R= 0.0455 inches (round your response to four decimal places). The control limits for the 3-sigma R-chart are: Upper Control Limit (UCLR) = 0.0962 inches (round your response to four decimal places). Lower Control Limit (LCLR) = inches (round your response to four decimal places). Refer to Table 56.1 - Factors for Computing Control Chart Limits (3 sigma) for this problem. Twelve samples, each containing five parts, were taken from a process that produces steel rods at Emmanual Kodzi's factory. The length of each rod in the samples was determined. The results were tabulated and sample means and ranges were computed. The results were: i X Range (in.) Sample Sample Mean (in.) 1 8.802 0.044 7 2 8.804 0.051 8 For the given data, the x = 8.8007 inches (round your 3 8.793 0.042 9 4 8.804 0.037 10 Based on the sampling done, the control limits for 3-sig 5 8.797 0.048 11 Upper Control Limit (UCL3) = 8.8269 inches (rour 6 8.799 0.053 12 Please copy and paste data from text area below. Selected delimiter: Tab Range (in.) Sample Sample Mean (in.) 8.803 0.021 8.803 0.058 8.797 0.039 8.801 0.038 8.801 0.054 8.804 0.061 Lower Control Limit (LCL2) = 8.7744 inches (roun Done Based on the x-chart, is one or more samples beyond the control limits? No Problem 6s.11ac Sample Range (in.) Sample Sample Mean (in.) Range (in.) 1 2 3 Sample Mean (in.) 8.802 8.804 8.793 8.804 8.797 8.799 0.044 0.051 0.042 0.037 0.048 0.053 7 8 9 10 8.803 8.803 8.797 8.801 8.801 8.804 0.021 0.058 0.039 0.038 0.054 0.061 4 5 6 12 For the given data, the x = 8.8007 inches (round your response to four decimal places). Based on the sampling done, the control limits for 3-sigma x chart are: Upper Control Limit (UCL;) = 8.8269 inches (round your response to four decimal places). Lower Control Limit (LCL;) = 8.7744 inches (round your response to four decimal places). Based on the x-chart, is one or more samples beyond the control limits? No For the given data, the R= 0.0455 inches (round your response to four decimal places). The control limits for the 3-sigma R-chart are: Upper Control Limit (UCLR) = 0.0962 inches (round your response to four decimal places). Lower Control Limit (LCLR) = inches (round your response to four decimal places)


