

Question: No other information is given. I submitted the question and the depreciation tables 1-5. Thanks. Required information (The following information applies to the questions displayed
No other information is given. I submitted the question and the depreciation tables 1-5. Thanks.
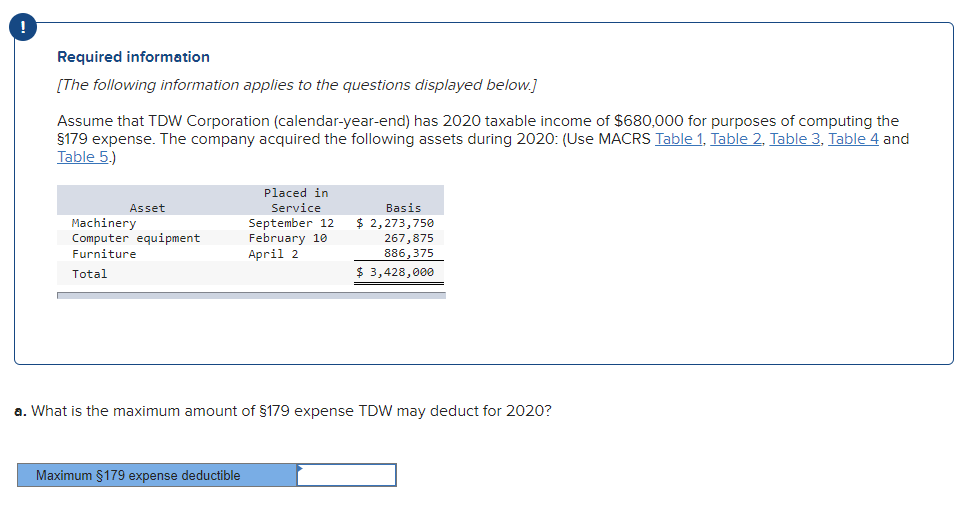
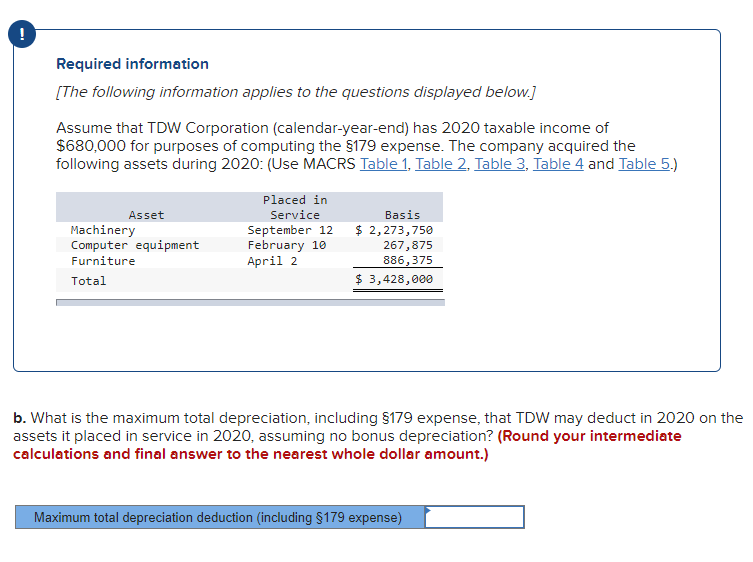
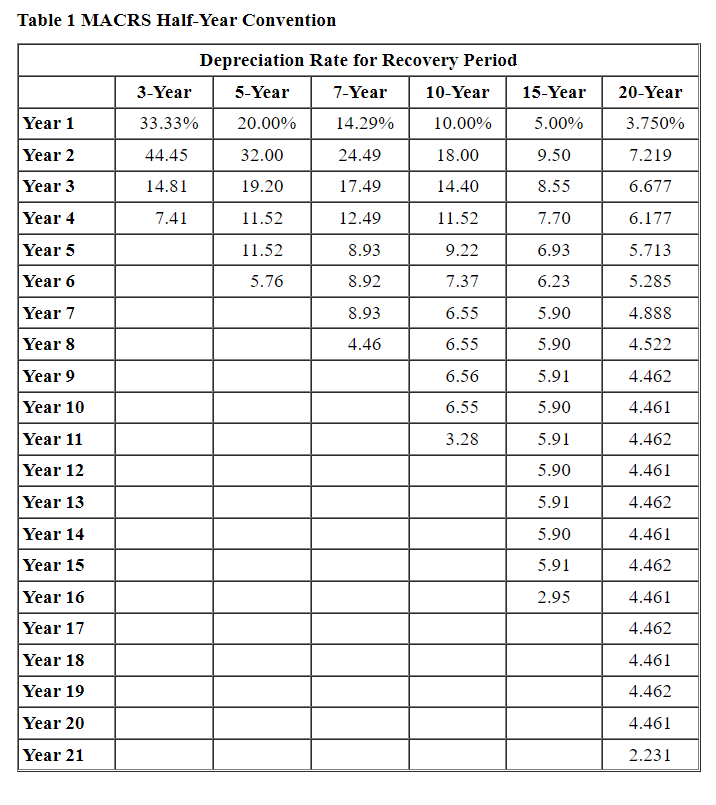
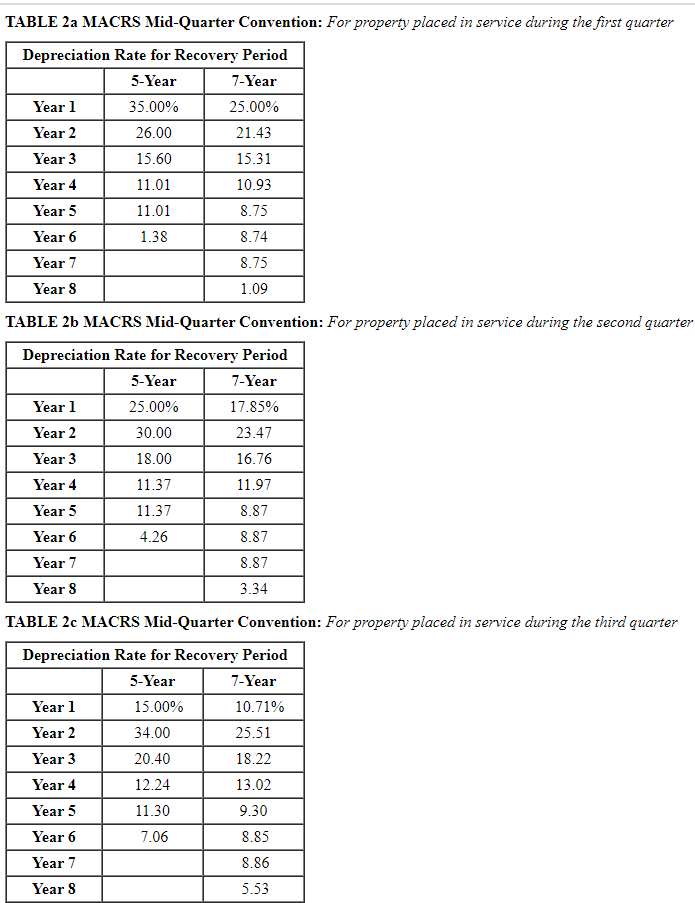
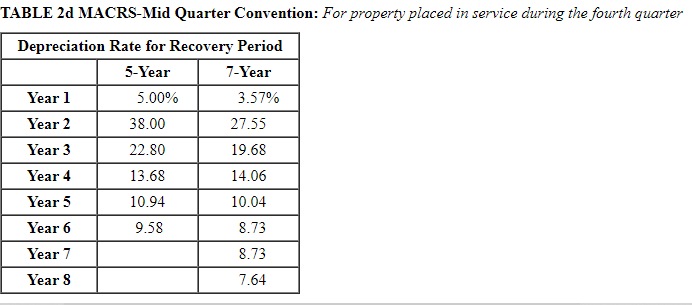
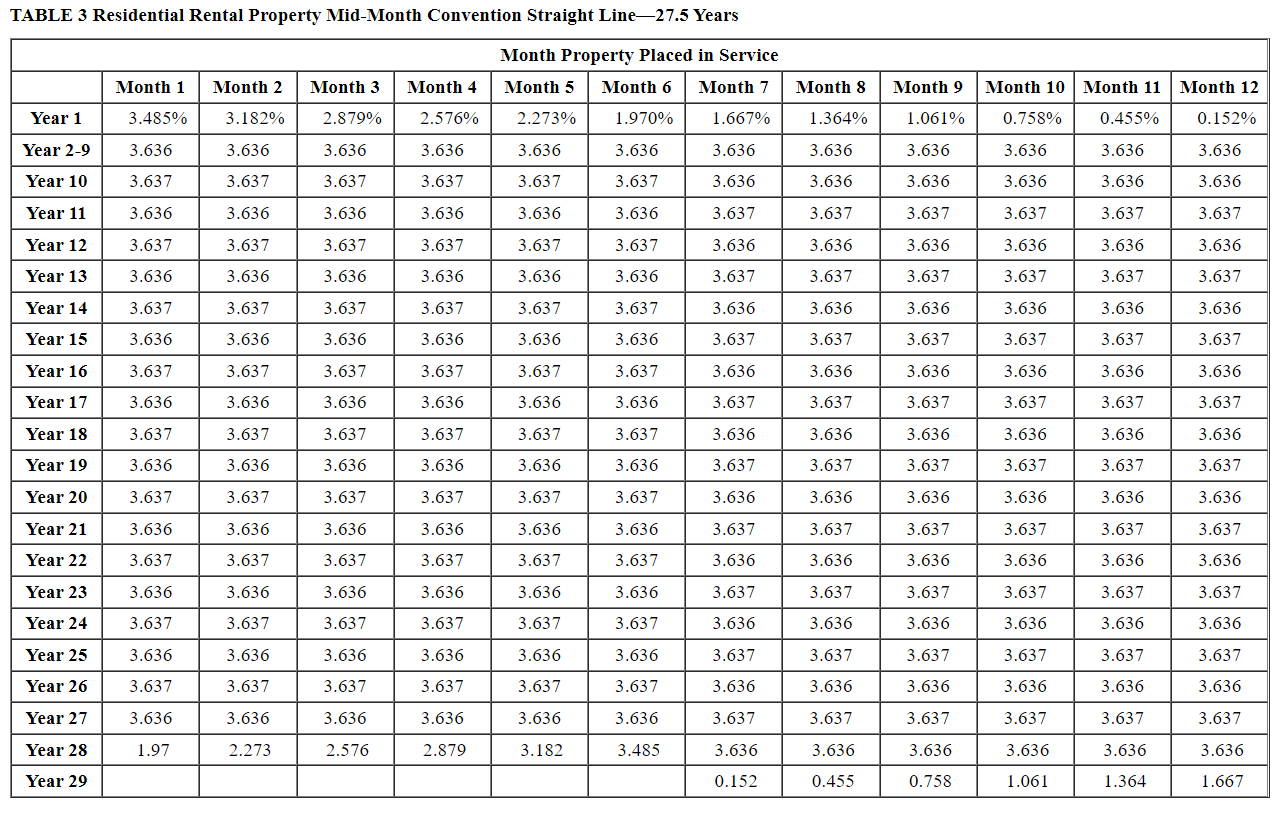
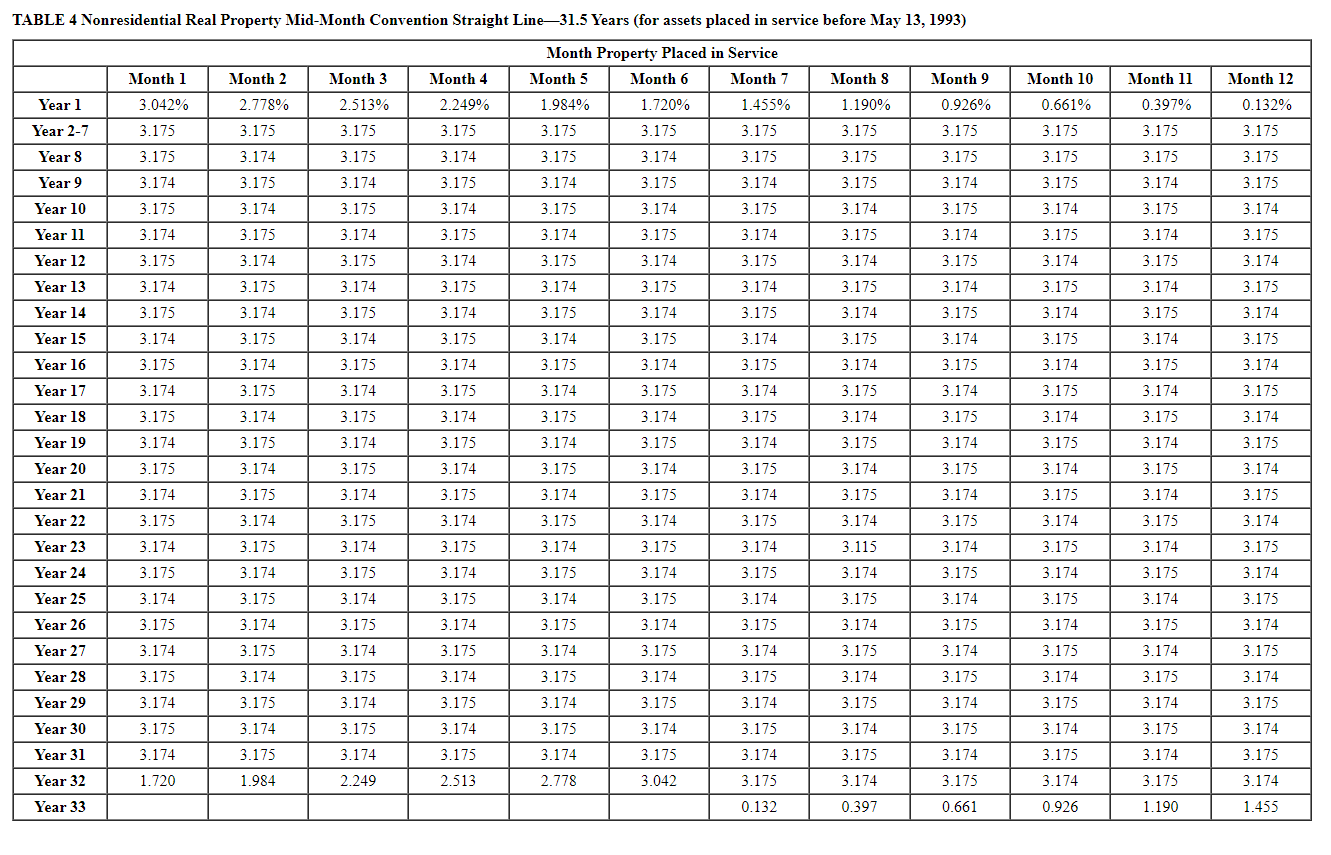
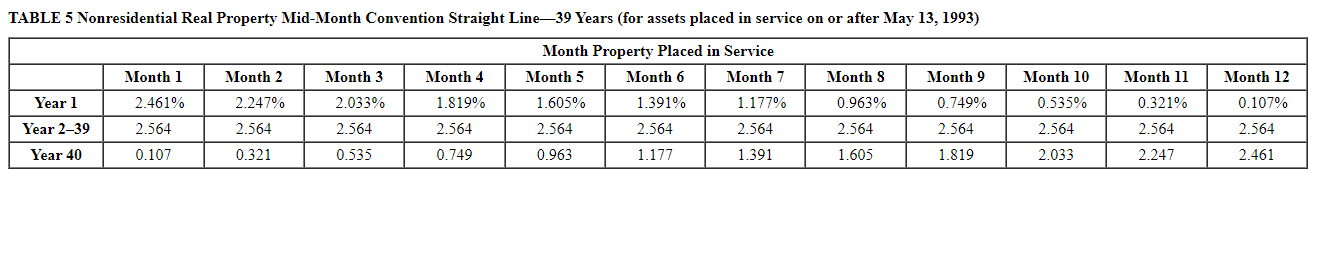
Required information (The following information applies to the questions displayed below.) Assume that TDW Corporation (calendar-year-end) has 2020 taxable income of $680,000 for purposes of computing the $179 expense. The company acquired the following assets during 2020: (Use MACRS Table 1, Table 2. Table 3, Table 4 and Table 5.) Asset Machinery Computer equipment Furniture Total Placed in Service September 12 February 10 April 2 Basis $ 2,273,750 267,875 886,375 3,428,000 a. What is the maximum amount of $179 expense TDW may deduct for 2020? Maximum $179 expense deductible Required information [The following information applies to the questions displayed below.) Assume that TDW Corporation (calendar-year-end) has 2020 taxable income of $680,000 for purposes of computing the $179 expense. The company acquired the following assets during 2020: (Use MACRS Table 1, Table 2. Table 3, Table 4 and Table 5.) Asset Machinery Computer equipment Furniture Total Placed in Service September 12 February 10 April 2 Basis $ 2,273,750 267,875 886,375 $ 3,428,000 b. What is the maximum total depreciation, including $179 expense, that TDW may deduct in 2020 on the assets it placed in service in 2020, assuming no bonus depreciation? (Round your intermediate calculations and final answer to the nearest whole dollar amount.) Maximum total depreciation deduction (including $179 expense) Table 1 MACRS Half-Year Convention Depreciation Rate for Recovery Period 3-Year 5-Year 7-Year 10-Year 15-Year 33.33% 20.00% 14.29% 10.00% 5.00% 20-Year Year 1 3.750% Year 2 44.45 32.00 24.49 18.00 9.50 7.219 Year 3 14.81 19.20 17.49 14.40 8.55 6.677 Year 4 7.41 11.52 12.49 11.52 7.70 6.177 Year 5 11.52 8.93 9.22 6.93 5.713 Year 6 5.76 8.92 7.37 6.23 5.285 8.93 6.55 5.90 4.888 Year 7 Year 8 4.46 6.55 5.90 4.522 Year 9 6.56 5.91 4.462 Year 10 6.55 5.90 4.461 Year 11 3.28 5.91 4.462 Year 12 5.90 4.461 Year 13 5.91 4.462 Year 14 5.90 4.461 5.91 4.462 Year 15 Year 16 2.95 4.461 Year 17 4.462 Year 18 4.461 4.462 Year 19 Year 20 4.461 Year 21 2.231 TABLE 2a MACRS Mid-Quarter Convention: For property placed in service during the first quarter Depreciation Rate for Recovery Period 5-Year 7-Year Year 1 35.00% 25.00% Year 2 26.00 21.43 Year 3 15.60 15.31 Year 4 11.01 10.93 Year 5 11.01 8.75 Year 6 1.38 8.74 Year 7 8.75 Year 8 1.09 TABLE 26 MACRS Mid-Quarter Convention: For property placed in service during the second quarter Depreciation Rate for Recovery Period 5-Year 7-Year Year 1 25.00% 17.85% Year 2 30.00 23.47 Year 3 18.00 16.76 Year 4 11.37 11.97 Year 5 11.37 8.87 Year 6 4.26 8.87 Year 7 8.87 Year 8 3.34 TABLE 2c MACRS Mid-Quarter Convention: For property placed in service during the third quarter Depreciation Rate for Recovery Period 5-Year 7-Year Year 1 15.00% 10.71% Year 2 34.00 25.51 Year 3 20.40 18.22 Year 4 12.24 13.02 Year 5 11.30 9.30 Year 6 7.06 8.85 Year 7 8.86 Year 8 5.53 TABLE 20 MACRS-Mid Quarter Convention: For property placed in service during the fourth quarter Depreciation Rate for Recovery Period 5-Year 7-Year Year 1 5.00% 3.57% Year 2 38.00 27.55 Year 3 22.80 19.68 Year 4 13.68 14.06 Year 5 10.94 10.04 Year 6 9.58 8.73 Year 7 8.73 Year 8 7.64 TABLE 3 Residential Rental Property Mid-Month Convention Straight Line27.5 Years Month Property Placed in Service Month 5 Month 6 Month 7 Month 1 Month 2 Month 3 Month 4 Month 8 Month 9 Month 10 Month 11 Month 12 Year 1 3.485% 3.182% 2.879% 2.576% 2.273% 1.970% 1.667% 1.364% 1.061% 0.758% 0.455% 0.152% Year 2-9 3.636 3.636 3.636 3.636 3.636 3.636 3.636 3.636 3.636 3.636 3.636 3.636 Year 10 3.637 3.637 3.637 3.637 3.637 3.637 3.636 3.636 3.636 3.636 3.636 3.636 Year 11 3.636 3.636 3.636 3.636 3.636 3.636 3.637 3.637 3.637 3.637 3.637 3.637 Year 12 3.637 3.637 3.637 3.637 3.637 3.637 3.636 3.636 3.636 3.636 3.636 3.636 Year 13 3.636 3.636 3.636 3.636 3.636 3.636 3.637 3.637 3.637 3.637 3.637 3.637 Year 14 3.637 3.637 3.637 3.637 3.637 3.637 3.636 3.636 3.636 3.636 3.636 3.636 Year 15 3.636 3.636 3.636 3.636 3.636 3.636 3.637 3.637 3.637 3.637 3.637 3.637 Year 16 3.637 3.637 3.637 3.637 3.637 3.637 3.636 3.636 3.636 3.636 3.636 3.636 Year 17 3.636 3.636 3.636 3.636 3.636 3.636 3.637 3.637 3.637 3.637 3.637 3.637 Year 18 3.637 3.637 3.637 3.637 3.637 3.637 3.636 3.636 3.636 3.636 3.636 3.636 Year 19 3.636 3.636 3.636 3.636 3.636 3.636 3.637 3.637 3.637 OL 3.637 3.637 3.637 Year 20 3.637 3.637 3.637 3.637 3.637 3.637 3.636 3.636 3.636 3.636 3.636 3.636 Year 21 3.636 3.636 3.636 3.636 3.636 3.636 3.637 3.637 3.637 3.637 3.637 3.637 Year 22 3.637 3.637 3.637 3.637 3.637 3.637 3.636 3.636 3.636 3.636 3.636 3.636 Year 23 3.636 3.636 3.636 3.636 3.636 3.636 3.637 3.637 3.637 3.637 3.637 3.637 Year 24 3.637 3.637 3.637 3.637 3.637 3.637 3.636 3.636 3.636 3.636 3.636 3.636 Year 25 3.636 3.636 3.636 3.636 3.636 3.636 3.637 3.637 3.637 3.637 3.637 3.637 Year 26 3.637 3.637 3.637 3.637 3.637 3.637 3.636 3.636 3.636 3.636 3.636 3.636 Year 27 3.636 3.636 3.636 3.636 3.636 3.636 3.637 3.637 3.637 3.637 3.637 3.637 Year 28 1.97 2.273 2.576 2.879 3.182 3.485 3.636 3.636 3.636 3.636 3.636 3.636 Year 29 0.152 0.455 0.758 1.061 1.364 1.667 TABLE 4 Nonresidential Real Property Mid-Month Convention Straight Line31.5 Years (for assets placed in service before May 13, 1993) Month 1 Month 3 Month 9 Month 10 Month 11 Year 1 Month 2 2.778% 3.175 3.042% Month 12 0.132% 2.513% 3.175 Month Property Placed in Service Month 5 Month 6 Month 7 1.984% 1.720% 1.455% 3.175 3.175 3.175 3.175 3.174 3.175 Month 8 1.190% 3.175 Month 4 2.249% 3.175 3.174 3.175 0.926% 3.175 0.661% 3.175 0.397% 3.175 Year 2-7 3.175 3.175 3.175 Years 3.175 3.174 3.175 3.175 3.175 3.175 3.175 Year 9 3.174 3.175 3.174 3.174 3.175 3.174 3.175 3.174 3.175 3.174 3.175 Year 10 3.175 3.175 3.174 3.175 3.174 3.175 3.174 3.175 3.174 3.174 3.174 3.175 3.175 3.174 Year 11 3.174 3.174 3.174 3.175 3.174 3.175 3.174 3.175 3.175 3.175 3.174 Year 12 3.175 3.174 3.175 3.174 3.175 3.174 3.175 3.175 3.174 3.175 3.174 3.174 3.175 3.174 3.175 3.174 3.175 3.175 3.174 3.174 3.174 3.175 Year 13 Year 14 Year 15 3.175 3.174 3.174 3.175 3.174 3.174 3.174 3.175 3.175 3.174 3.175 3.174 3.175 3.174 3.175 3.175 3.174 3.175 3.174 3.175 3.174 3.174 3.175 3.175 3.175 Year 16 3.175 3.174 3.175 3.175 3.174 3.174 3.175 3.174 3.175 3.174 3.174 3.175 3.175 3.174 Year 17 3.174 3.175 3.174 3.174 3.175 3.175 3.174 3.175 3.174 3.175 Year 18 3.175 3.174 3.175 3.174 3.175 3.174 3.175 3.174 3.175 3.174 3.175 3.174 Year 19 3.174 3.175 3.174 3.175 3.174 3.175 3.174 3.175 3.174 3.175 3.174 3.175 Year 20 3.174 3.174 3.174 3.175 3.174 3.175 3.174 3.174 3.175 3.175 3.174 3.174 3.175 3.174 3.175 3.174 3.175 3.175 3.174 Year 21 3.175 3.174 3.175 3.175 3.174 3.175 3.175 3.174 3.175 3.175 3.175 3.174 3.175 3.174 3.175 Year 22 Year 23 3.174 3.175 3.174 3.175 3.174 3.174 3.175 3.175 3.174 3.115 3.174 3.175 3.174 3.174 3.175 Year 24 3.175 3.174 3.175 3.174 3.175 3.174 3.175 3.174 3.175 3.174 3.174 3.175 3.174 3.174 3.175 3.174 3.174 3.175 3.174 3.175 3.174 3.175 3.174 Year 25 Year 26 3.175 3.175 3.175 3.175 3.175 3.175 3.175 3.174 3.174 3.175 3.174 3.175 3.174 3.175 Year 27 3.174 3.174 3.175 3.174 3.174 3.174 3.175 3.174 3.175 3.174 3.175 3.175 3.174 3.174 3.174 3.175 3.174 3.175 3.174 Year 28 Year 29 3.174 3.175 3.174 3.174 3.175 3.175 3.174 3.175 3.174 3.174 3.175 3.174 3.175 3.175 3.175 3.174 Year 30 3.175 3.174 3.175 3.174 3.174 3.175 3.174 3.175 3.174 3.175 3.174 3.175 3.174 Year 31 3.174 3.175 3.174 3.175 3.175 3.174 3.175 3.174 3.175 3.174 3.175 3.174 1.720 1.984 2.249 2.513 2.778 3.042 3.175 3.174 Year 32 Year 33 3.175 0.132 3.175 1.190 0.397 0.661 0.926 1.455 TABLE 5 Nonresidential Real Property Mid-Month Convention Straight Line39 Years (for assets placed in service on or after May 13, 1993) Month 1 Month 8 Month 9 Month 11 Month 12 Month 4 1.819% 2.461% Year 1 Year 239 Year 40 Month 2 2.247% 2.564 0.321 Month 3 2.033% 2.564 0.535 Month Property Placed in Service Month 5 Month 6 Month 7 1.605% 1.391% 1.177% 2.564 2.564 2.564 0.963 1.177 1.391 0.963% 2.564 0.749% 2.564 Month 10 0.535% 2.564 0.321% 2.564 0.107% 2.564 2.564 2.564 0.107 0.749 1.605 1.819 2.033 2.247 2.461
Step by Step Solution
There are 3 Steps involved in it

Get step-by-step solutions from verified subject matter experts