

Question: no Show all calculations. Include all units. Round all calculated values to the allowed significant figures. Box numerical answers. Density of a Nonaqueous Liquid 1.
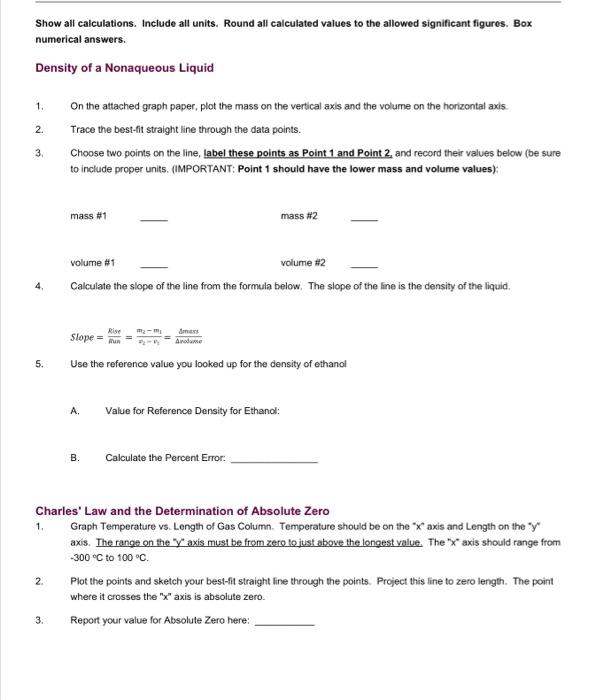
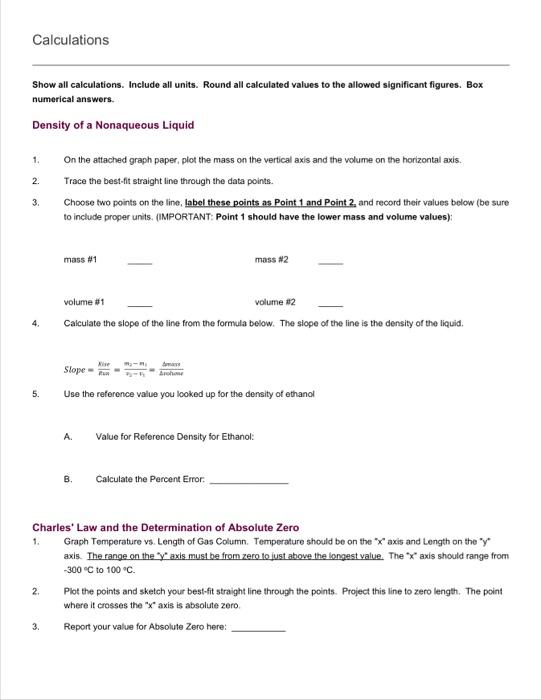
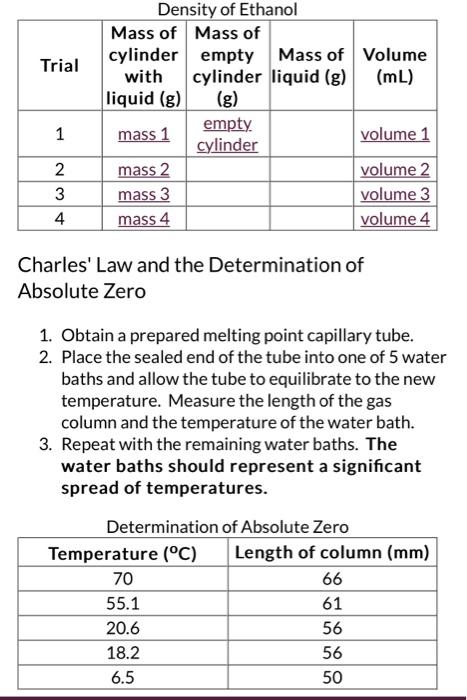
Show all calculations. Include all units. Round all calculated values to the allowed significant figures. Box numerical answers. Density of a Nonaqueous Liquid 1. On the attached graph paper, plot the mass on the vertical axis and the volume on the horizontal axis. 2. Trace the best-fit straight line through the data points. 3. Choose two points on the line, label these points as Point 1 and Point 2 and record their values below (be sure to include proper units. (IMPORTANT: Point 1 should have the lower mass and volume values): 4. Calculate the slope of the line from the formula below. The slope of the line is the density of the liquid. Slope=tunRRise=2v1m2m1=AncobareeAmass 5. Use the reference value you looked up for the density of ethanol A. Value for Reference Density for Ethanol: B. Calculate the Percent Error: Charles' Law and the Determination of Absolute Zero 1. Graph Temperature vs. Length of Gas Column. Temperature should be on the " x " axis and Length on the " y " axis. The range on the " y " axis must be from zero to just above the longest value. The " x " axis should range from 300C to 100C. 2. Plot the points and sketch your best-fit straight line through the points. Project this line to zero length. The point where it crosses the " x " axis is absolute zero. 3. Report your value for Absolute Zero here: Show all calculations. Include all units. Round all calculated values to the allowed significant figures. Bex numerical answers. Density of a Nonaqueous Liquid 1. On the attached graph paper, plot the mass on the vertical axis and the volume on the horizontal axis. 2. Trace the best-fit straight line through the data points. 3. Choose two points on the line, label these points as Point 1 and Point 2 and record their values below (be sure to include proper units. (IMPORTANT: Point 1 should have the lower mass and volume values): volume \#1 volume $2 4. Calculate the slope of the line from the formula below. The siope of the line is the density of the liquid. 5. Use the reference value you looked up for the density of ethanol A. Value for Reference Density for Ethanol: B. Calculate the Percent Error: Charles' Law and the Determination of Absolute Zero 1. Graph Temperature vs. Length of Gas Column. Temperature should be on the " x " axis and Length on the " y " axis. The range on the " y " axis must be from zero lo just above the lengest value. The " x " axis should range from 300C to 100C. 2. Plot the points and sketch your best-fit straight line through the points. Project this line to zero length. The point where it crosses the " x " axis is absolute zero. 3. Report your value for Absolute Zero here: nancityonf Fthanal Charles' Law and the Determination of Absolute Zero 1. Obtain a prepared melting point capillary tube. 2. Place the sealed end of the tube into one of 5 water baths and allow the tube to equilibrate to the new temperature. Measure the length of the gas column and the temperature of the water bath. 3. Repeat with the remaining water baths. The water baths should represent a significant spread of temperatures. Determination of Absolute Zero 4. How does this compare to the accepted value and why might your answer be off from the accepted value? Calculate the Percent Error: PercentError=100%referencevahie(referencevalueexperimentalvalue)) Show all calculations. Include all units. Round all calculated values to the allowed significant figures. Box numerical answers. Density of a Nonaqueous Liquid 1. On the attached graph paper, plot the mass on the vertical axis and the volume on the horizontal axis. 2. Trace the best-fit straight line through the data points. 3. Choose two points on the line, label these points as Point 1 and Point 2 and record their values below (be sure to include proper units. (IMPORTANT: Point 1 should have the lower mass and volume values): 4. Calculate the slope of the line from the formula below. The slope of the line is the density of the liquid. Slope=tunRRise=2v1m2m1=AncobareeAmass 5. Use the reference value you looked up for the density of ethanol A. Value for Reference Density for Ethanol: B. Calculate the Percent Error: Charles' Law and the Determination of Absolute Zero 1. Graph Temperature vs. Length of Gas Column. Temperature should be on the " x " axis and Length on the " y " axis. The range on the " y " axis must be from zero to just above the longest value. The " x " axis should range from 300C to 100C. 2. Plot the points and sketch your best-fit straight line through the points. Project this line to zero length. The point where it crosses the " x " axis is absolute zero. 3. Report your value for Absolute Zero here: Show all calculations. Include all units. Round all calculated values to the allowed significant figures. Bex numerical answers. Density of a Nonaqueous Liquid 1. On the attached graph paper, plot the mass on the vertical axis and the volume on the horizontal axis. 2. Trace the best-fit straight line through the data points. 3. Choose two points on the line, label these points as Point 1 and Point 2 and record their values below (be sure to include proper units. (IMPORTANT: Point 1 should have the lower mass and volume values): volume \#1 volume $2 4. Calculate the slope of the line from the formula below. The siope of the line is the density of the liquid. 5. Use the reference value you looked up for the density of ethanol A. Value for Reference Density for Ethanol: B. Calculate the Percent Error: Charles' Law and the Determination of Absolute Zero 1. Graph Temperature vs. Length of Gas Column. Temperature should be on the " x " axis and Length on the " y " axis. The range on the " y " axis must be from zero lo just above the lengest value. The " x " axis should range from 300C to 100C. 2. Plot the points and sketch your best-fit straight line through the points. Project this line to zero length. The point where it crosses the " x " axis is absolute zero. 3. Report your value for Absolute Zero here: nancityonf Fthanal Charles' Law and the Determination of Absolute Zero 1. Obtain a prepared melting point capillary tube. 2. Place the sealed end of the tube into one of 5 water baths and allow the tube to equilibrate to the new temperature. Measure the length of the gas column and the temperature of the water bath. 3. Repeat with the remaining water baths. The water baths should represent a significant spread of temperatures. Determination of Absolute Zero 4. How does this compare to the accepted value and why might your answer be off from the accepted value? Calculate the Percent Error: PercentError=100%referencevahie(referencevalueexperimentalvalue))
Step by Step Solution
There are 3 Steps involved in it

Get step-by-step solutions from verified subject matter experts