

Question: No work is needed, only the correct answer please: Use the central limit theorem to find the mean and standard error of the mean of
No work is needed, only the correct answer please:
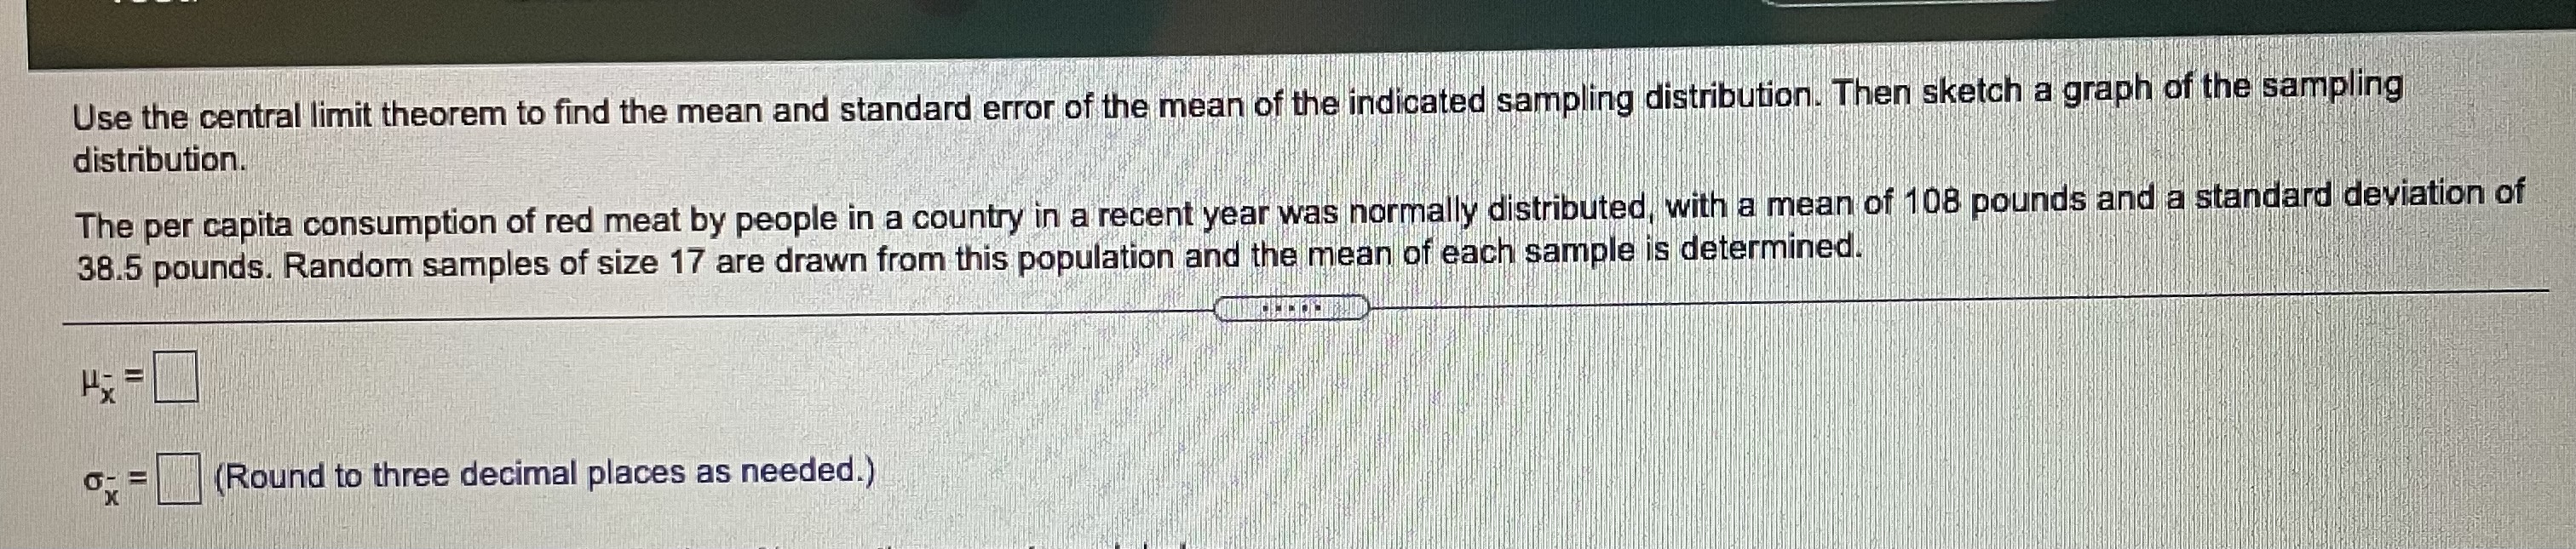

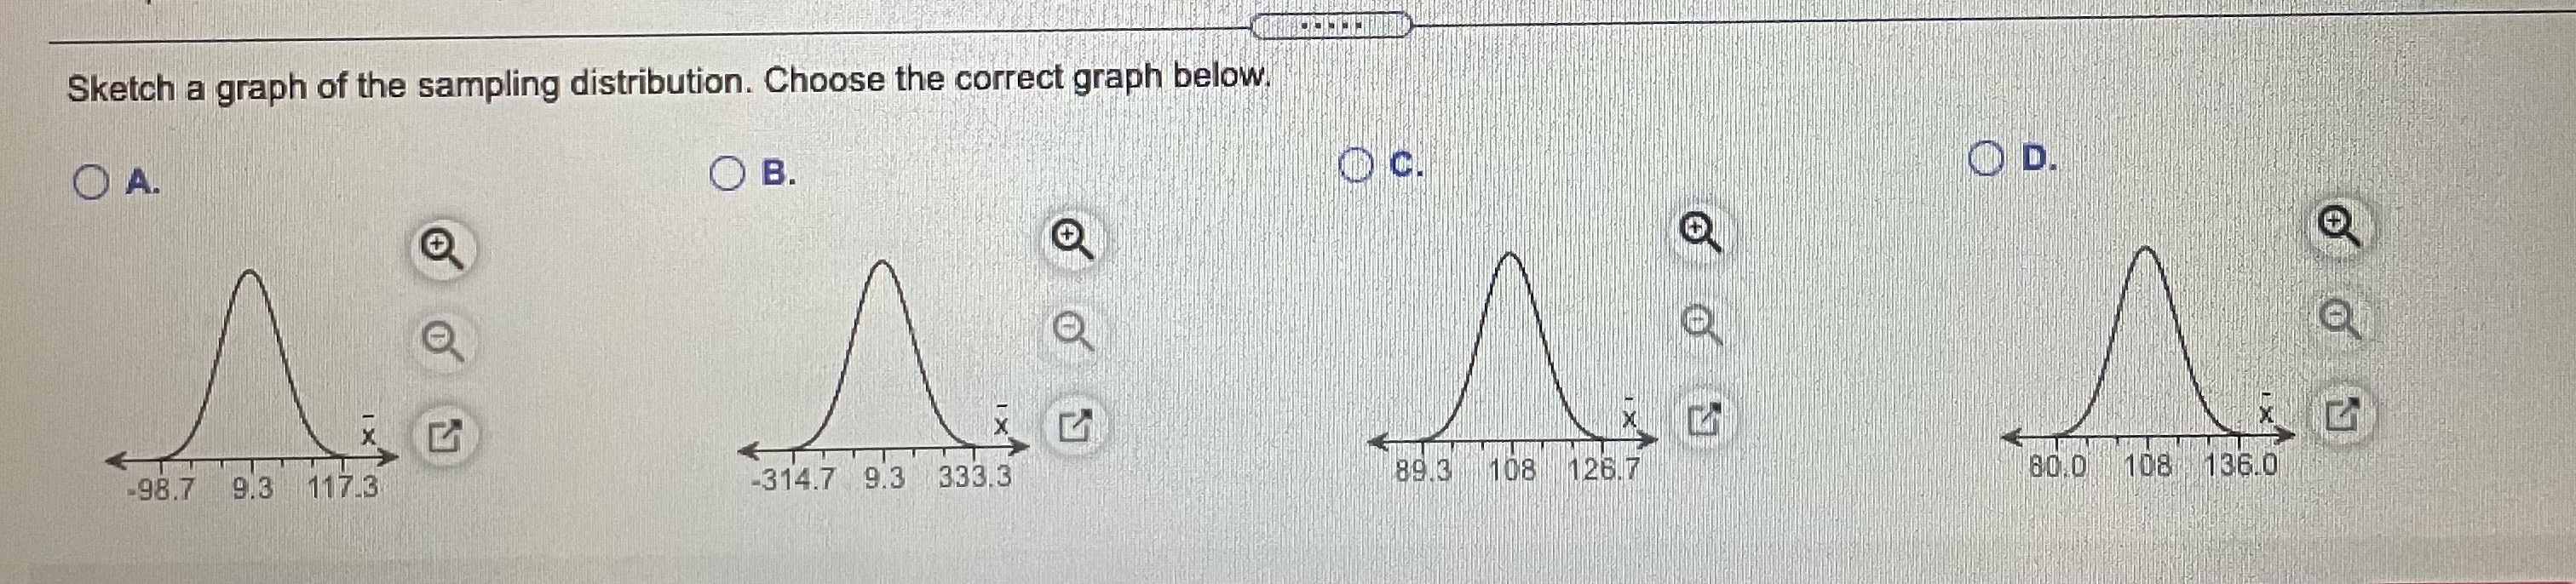
Use the central limit theorem to find the mean and standard error of the mean of the indicated sampling distribution. Then sketch a graph of the sampling distribution. The per capita consumption of red meat by people in a country in a recent year was normally distributed, with a mean of 108 pounds and a standard deviation of 38.5 pounds. Random samples of size 17 are drawn from this population and the mean of each sample is determined. (Round to three decimal places as needed.)Use the central limit theorem to find the mean and standard error of the mean of the indicated sampling distribution. Then sketch a graph of the sampling distribution. The per capita consumption of red meat by people in a country in a recent year was normally distributed, with a mean of 108 pounds and a standard deviation of 38.5 pounds. Random samples of size 17 are drawn from this population and the mean of each sample is determined. (Round to three decimal places as needed.)Sketch a graph of the sampling distribution. Choose the correct graph below, O A. O B. D XI XI X x -98.7 9.3 117.3 -314.7 9.3 333.3 89 3 168 126.7 60.0 108 136.0Sketch a graph of the sampling distribution. Choose the correct graph below, O A. O B. D XI XI X x -98.7 9.3 117.3 -314.7 9.3 333.3 89 3 168 126.7 60.0 108 136.0
Step by Step Solution
There are 3 Steps involved in it

Get step-by-step solutions from verified subject matter experts