

Question: 5 questions all together.... each file has a # on it The heights of fully grown trees of a specic species are normallyr distributed, with
5 questions all together.... each file has a # on it
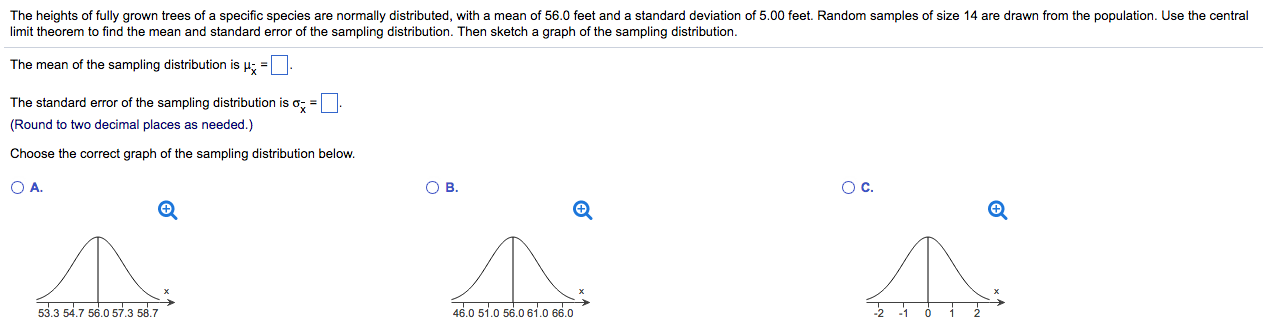
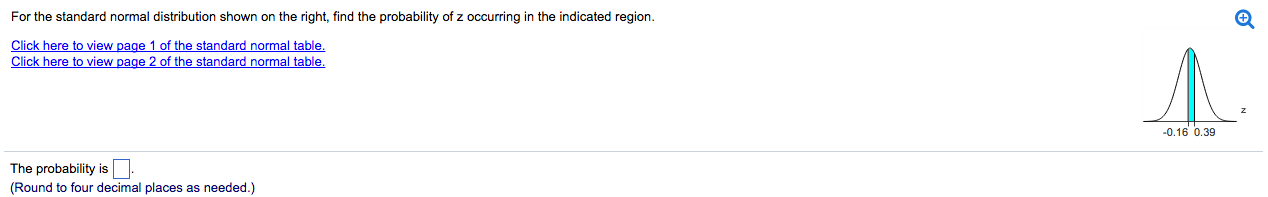
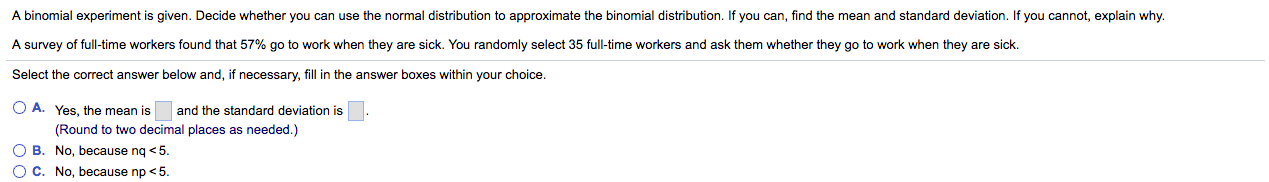
The heights of fully grown trees of a specic species are normallyr distributed, with a mean of 56.0 feet and a standard deviation of 5.00 feet. Random samples of slze 14 are drawn from tl'e population. Use the central limit theorem tnnd the mean and standard error of the sampling distribution. Then sketch a graph of the sampling distribution. The mean of the sampling distribution is "it = The standard error ofthe sampling distribution is o; = (Round to two decimal pla as needed.) Choose the correct graph ofthe sampling distribution below. DA. DB. 00. Q Q G. 53.3 54.? 56.0 5f} 53.? 46.0 51.0 56.0 61.0 66.0 -2 -1 O 1 2 For the slendard normal distribution shown on the right. nd the probability of z oacurring in the indicated region' Click here In View page 1 of the standard nnrmai [able Click here lo View gage 2 of the standard normai table 4,16 039 The probability is ' (Roe nd In four decimal pieces as needed.) Determine whether the statement is true or false. if it is False, rewrite it as a true statement. As the size of a sample increasesI the standard deviation of the distribution at sample means increases. Choose the correct choice below. 0 A. This statement is false. A true statement is O B. This statement is false. A true statement 0 C. This statement is true. 0 D. This statement is False. A true statement is, "As the size at a sample increasa, the standard deviation of the distribution of sample means doi not change.\" "As the size at a sample increases, the standard deviation of the distribution of sample means decreases." "As the size at a sample demeases, the standard deviation of the distribution oi sample means demeases.' Flnd the indicaled area under the standard nurrnal curve. Between 2: - 3.03 and z= 3.03 Cllck here to \ lew we 1 of the standard normal table. Cllck here to vlew page 2 of the standard normal table. The area between 2 = 3.03 and z: 3.03 under the standard normal curve is (Round In four decimal places as needed.) A binomial experiment is given. Decide whether you can use the normal distribution to approximate the binomial distribution. If you can, nd the mean and standard deviation. if you cannot, explain why. A survey offull-time workers found that 57% go to work when they are sick. You randome select 35 full-time workers and ask them whether they go to work when they are sick. Select the correct answer below and, if necessary, ml in the answer boxes within your choice. O A- Yes, the mean is and the standard deviation is (Round to two decimal pleo as needed.) 0 B. No, because no
Step by Step Solution
There are 3 Steps involved in it

Get step-by-step solutions from verified subject matter experts