

Question: Normal Distribution and Errors in Measurement 2 Watch the following video (the first two minutes is all you need to watch): [LINK] [+] Whenever
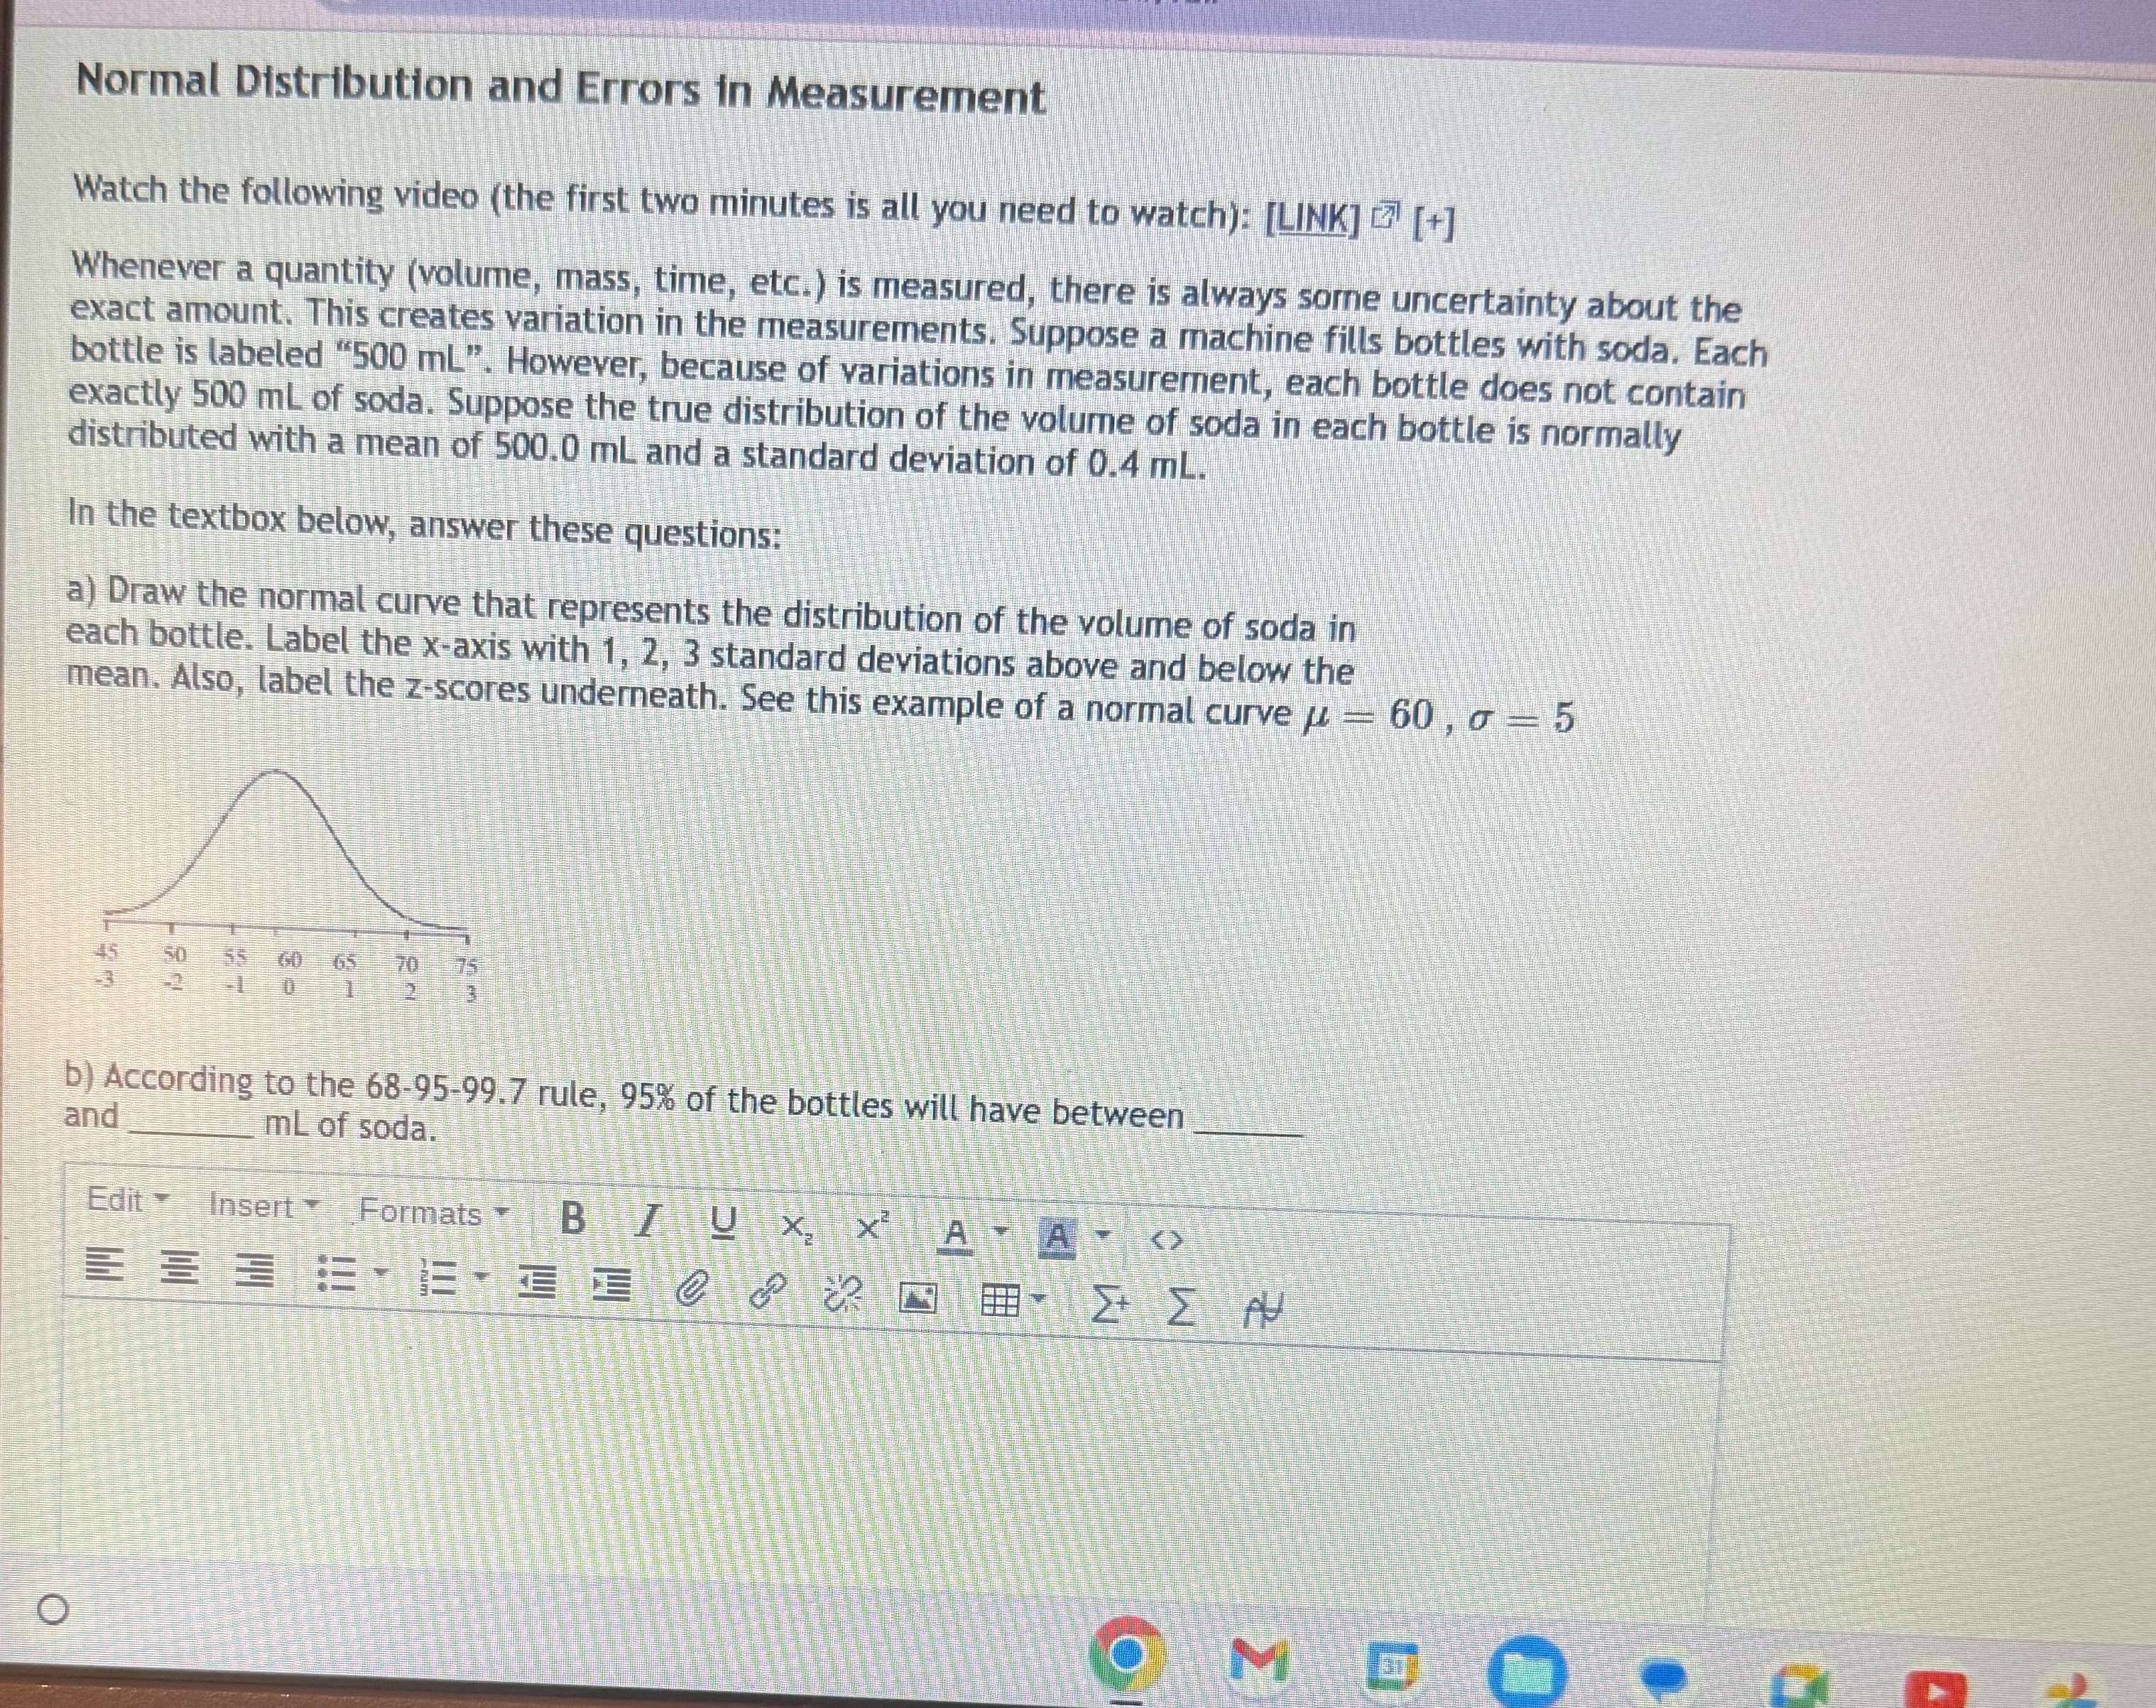
Normal Distribution and Errors in Measurement 2 Watch the following video (the first two minutes is all you need to watch): [LINK] [+] Whenever a quantity (volume, mass, time, etc.) is measured, there is always sore uncertainty about the exact amount. This creates variation in the measurements. Suppose a machine fills bottles with soda. Each bottle is labeled "500 mL". However, because of variations in measurement, each bottle does not contain exactly 500 mL of soda. Suppose the true distribution of the volume of soda in each bottle is normally distributed with a mean of 500.0 mL and a standard deviation of 0.4 mL. In the textbox below, answer these questions: a) Draw the normal curve that represents the distribution of the volume of soda in each bottle. Label the x-axis with 1, 2, 3 standard deviations above and below the mean. Also, label the z-scores underneath. See this example of a normal curve 60,0 5 45 50 65 70 3 b) According to the 68-95-99.7 rule, 95% of the bottles will have between and mL of soda. Edit Insert Formats O B/UX x AA M
Step by Step Solution
There are 3 Steps involved in it

Get step-by-step solutions from verified subject matter experts