

Question: Consider the following data for two variables, x and y. Excel File: data14-51.xlsx a. Consider the three scatter diagrams below. 1. y +35 2
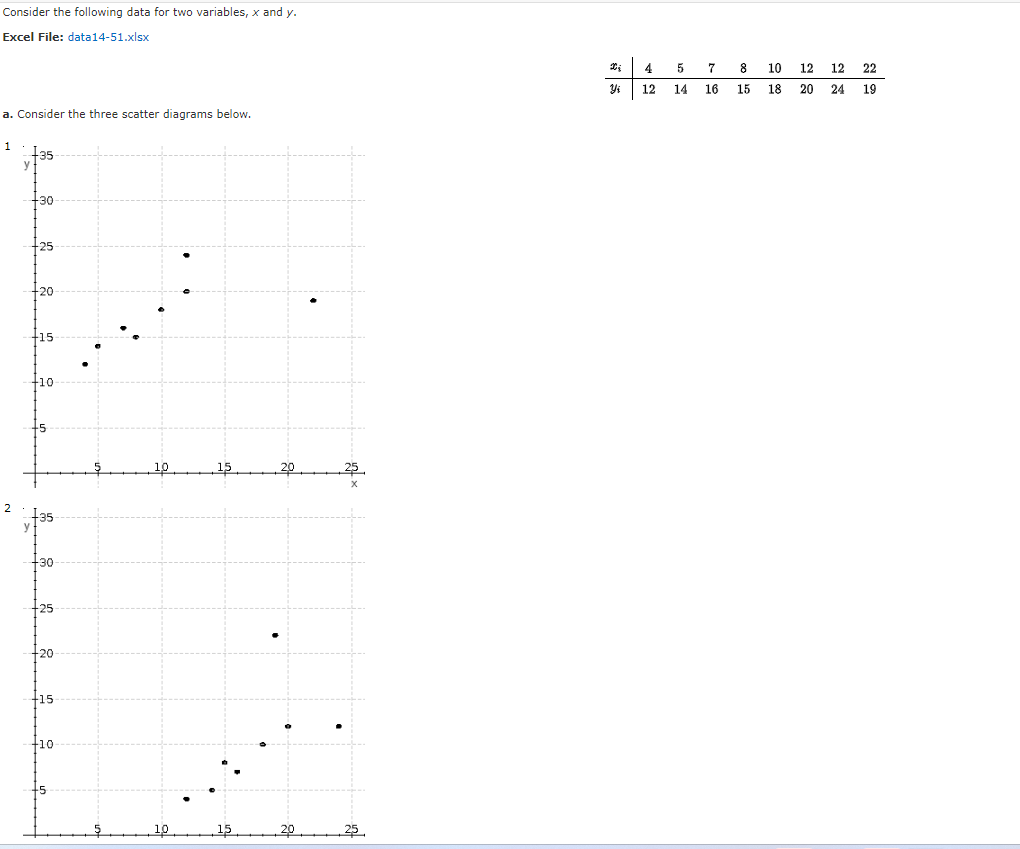
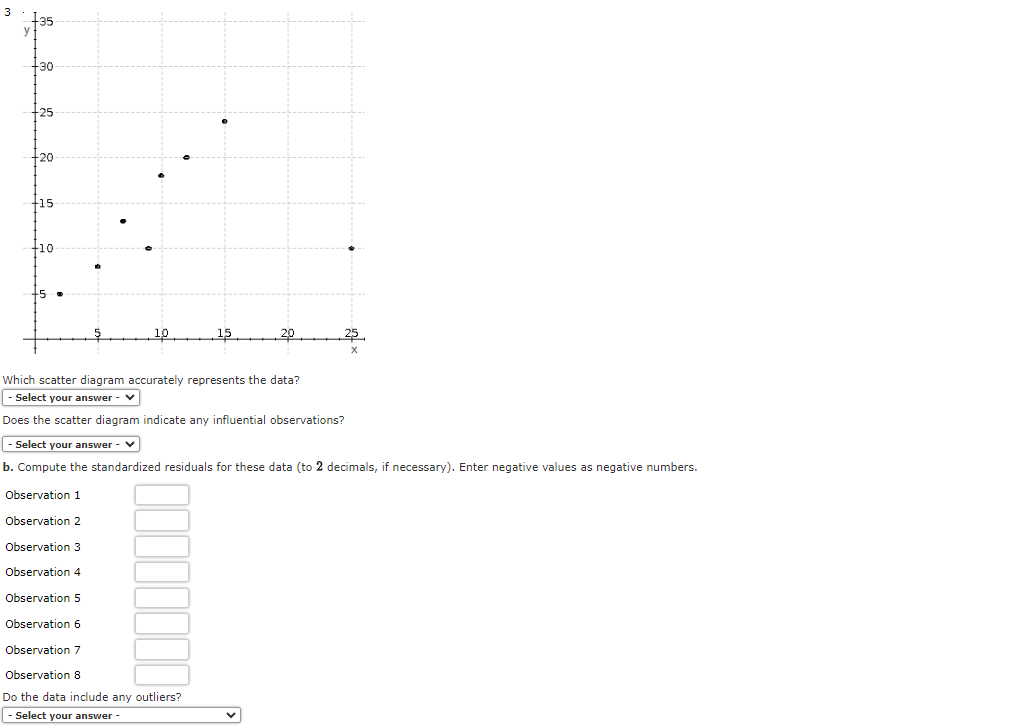
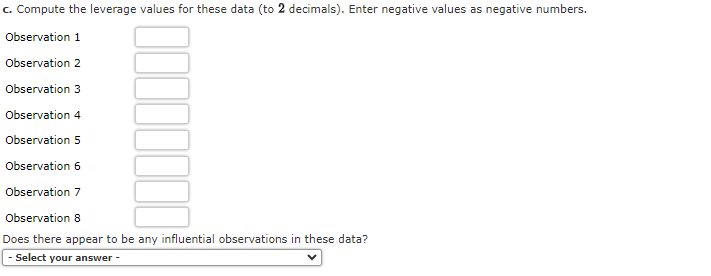
Consider the following data for two variables, x and y. Excel File: data14-51.xlsx a. Consider the three scatter diagrams below. 1. y +35 2 30 25 20 +15 10 30 25 -20 +15 10 5 10 10 15 20 25 15 20 25 4 5 7 8 10 12 12 22 Yi 12 14 16 15 18 20 24 19 3 +35 30 25 -20 +15 -10 -5 10 15 20 x Which scatter diagram accurately represents the data? Select your answer - Does the scatter diagram indicate any influential observations? -Select your answer - b. Compute the standardized residuals for these data (to 2 decimals, if necessary). Enter negative values as negative numbers. Observation 1 Observation 2 Observation 3 Observation 4 Observation 5 Observation 6 Observation 7 Observation 8 Do the data include any outliers? - Select your answer- c. Compute the leverage values for these data (to 2 decimals). Enter negative values as negative numbers. Observation 1 Observation 2 Observation 3 Observation 4 Observation 5 Observation 6 Observation 7 Observation 8 Does there appear to be any influential observations in these data? - Select your answer -
Step by Step Solution
There are 3 Steps involved in it

Get step-by-step solutions from verified subject matter experts