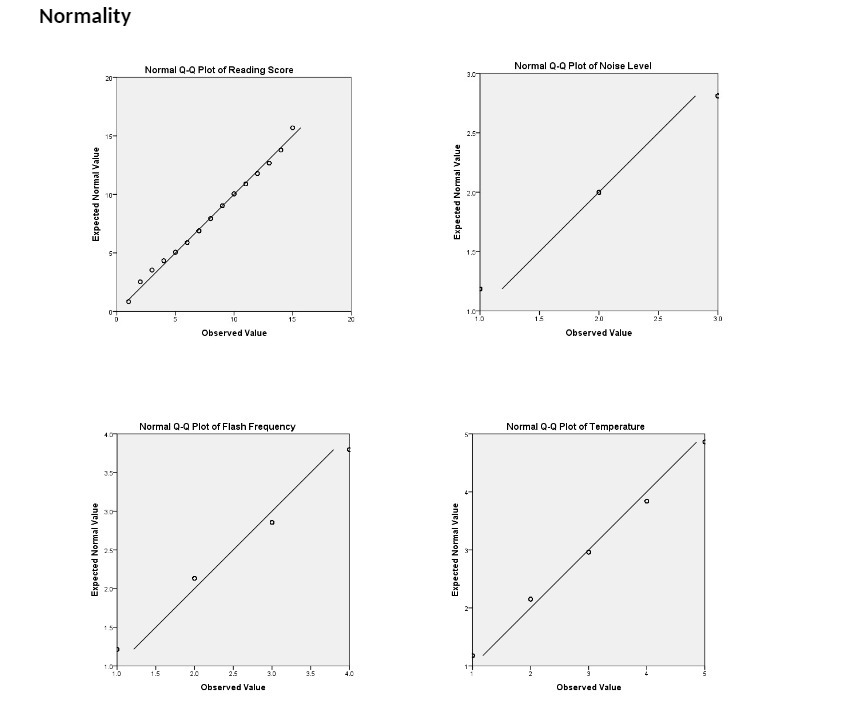
Question: Normality Normal Q-Q Plot of Reading Score Normal Q-Q Plot of Noise Level 20- 3.0 15 2.5- 10- Expected Normal Value Expected Normal Value 2.0

Normality Normal Q-Q Plot of Reading Score Normal
Normality Normal Q-Q Plot of Reading Score Normal Q-Q Plot of Noise Level 20- 3.0 15 2.5- 10- Expected Normal Value Expected Normal Value 2.0 15- 15 1's 2'S 30 Observed Value Observed Value Normal Q-Q Plot of Flash Frequency Normal Q-Q Plot of Temperature 15- 30 Expected Normal Value Expected Normal Value 25- 20 2- 15- Observed Value Observed Value

Step by Step Solution

There are 3 Steps involved in it

1 Expert Approved Answer
Step: 1 Unlock blur-text-image
Question Has Been Solved by an Expert!

Get step-by-step solutions from verified subject matter experts

Step: 2 Unlock
Step: 3 Unlock

Students Have Also Explored These Related Mathematics Questions!