

Question: Not everyone pays the same price for the same model of a car. The figure illustrates a normal distribution for the prices paid for a
Not everyone pays the same price for the same model of a car. The figure illustrates a normal distribution for the prices paid for a particular model of a new car. The mean is $21,000 and the standard deviation is $1000. Use the 68-95-99.7 Rule to find the percentage of buyers who paid less than $18,000.A graph has a horizontal axis labeled "Price of a Model of a New Car (Thousands)" from 18 to 24 in increments of 1 and a vertical axis labeled "Number of Car Buyers." A bell curve on the graph is centered at 21. The curve shows that approximately 68% fall between 20 and 22, approximately 95% fall between 19 and 23, and approximately 99.7% fall between 18 and 24.The percentage of buyers who paid less than $18,000 is ____%
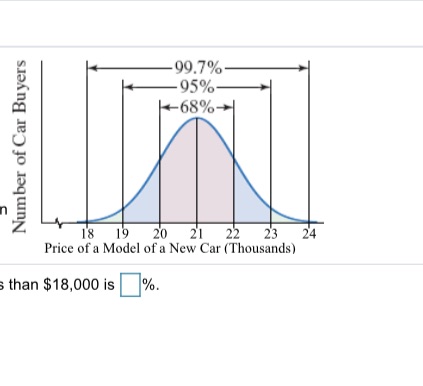
99.7% Number of Car Buyers 24 Price of a Model of a New Car (Thousands) than $18,000 is %
Step by Step Solution
There are 3 Steps involved in it

Get step-by-step solutions from verified subject matter experts