

Question: Not everyone pays the same price for the same model of a car. The figure illustrates a normal distribution for the prices paid for a

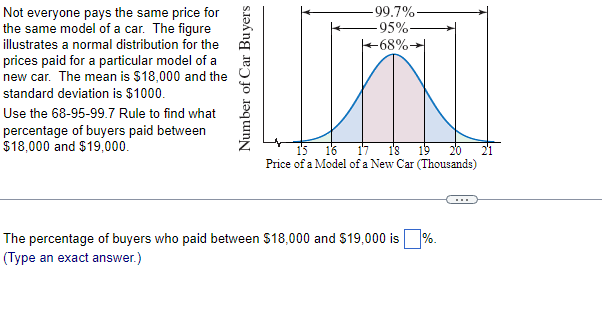

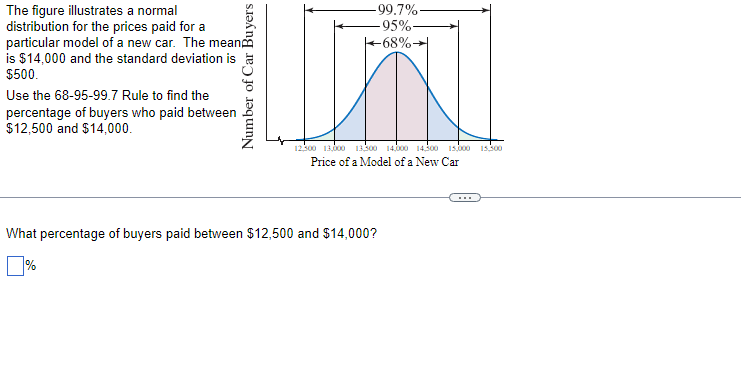
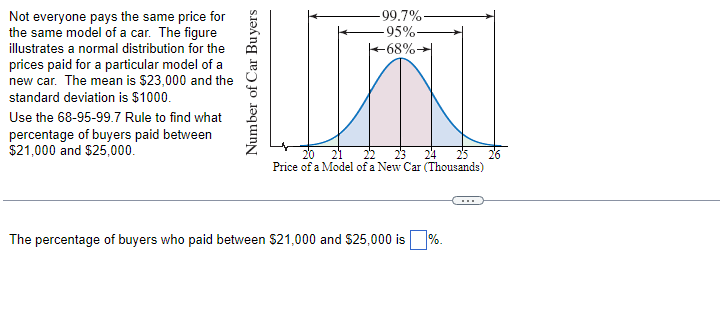

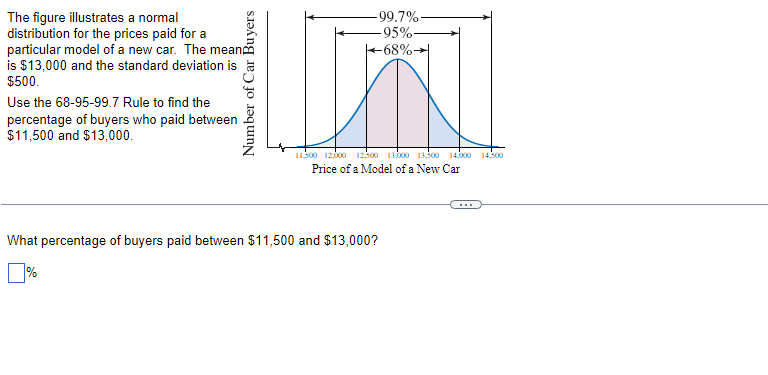

Not everyone pays the same price for the same model of a car. The figure illustrates a normal distribution for the prices paid for a particular model of a new car. The mean is $23,000 and the Number of Car Buyers standard deviation is $1000. Use the 68-95-99.7 Rule to find what percentage of buyers paid between $21,000 and $25,000. Price of a Model of a New Car (Thousands) The percentage of buyers who paid between $21,000 and $25,000 is %Not everyone pays the same price for the same model of a car. The figure illustrates a normal distribution for the prices paid for a particular model of a new car. The mean is $18,000 and the Number of Car Buyers standard deviation is $1000. Use the 68-95-99.7 Rule to find what percentage of buyers paid between $18,000 and $19,000. Price of a Model of a New Car (Thousands) The percentage of buyers who paid between $18,000 and $19,000 is (Type an exact answer.)The figure illustrates a normal distribution for the prices paid for a particular model of a new car. The mean is $13,000 and the standard deviation is $500. Number of Car Buyers Use the 68-95-99.7 Rule to find the percentage of buyers who paid between $11,500 and $13,000. Price of a Model of a New Car What percentage of buyers paid between $11,500 and $13,000? %%The figure illustrates a normal 99.7% distribution for the prices paid for a particular model of a new car. The meang is $14,000 and the standard deviation is $500. Number of Car Buyers Use the 68-95-99.7 Rule to find the percentage of buyers who paid between $12,500 and $14,000. Price of a Model of a New Car What percentage of buyers paid between $12,500 and $14,000? %
Step by Step Solution
There are 3 Steps involved in it

Get step-by-step solutions from verified subject matter experts