

Question: Not sure how to do part D. How do you plot the 7 independent variables versus power demand? Obs Day Temp Demand 1 1 92
Not sure how to do part D. How do you plot the 7 independent variables versus power demand?
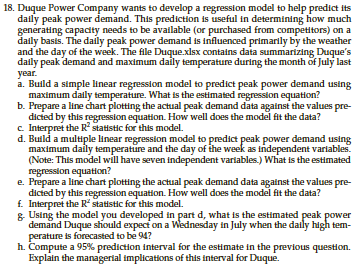
| Obs | Day | Temp | Demand |
| 1 | 1 | 92 | 57.7 |
| 2 | 2 | 96 | 71.5 |
| 3 | 3 | 96 | 73 |
| 4 | 4 | 89 | 68.6 |
| 5 | 5 | 95 | 71.2 |
| 6 | 6 | 94 | 67.2 |
| 7 | 7 | 99 | 62.7 |
| 8 | 1 | 96 | 64.6 |
| 9 | 2 | 96 | 68.5 |
| 10 | 3 | 91 | 68.8 |
| 11 | 4 | 93 | 65.8 |
| 12 | 5 | 88 | 61.5 |
| 13 | 6 | 90 | 57.6 |
| 14 | 7 | 92 | 54.2 |
| 15 | 1 | 98 | 61.1 |
| 16 | 2 | 94 | 64.5 |
| 17 | 3 | 99 | 68.6 |
| 18 | 4 | 94 | 67.1 |
| 19 | 5 | 98 | 76.2 |
| 20 | 6 | 94 | 65.7 |
| 21 | 7 | 97 | 60.9 |
| 22 | 1 | 88 | 54.5 |
| 23 | 2 | 92 | 69.7 |
| 24 | 3 | 89 | 68.3 |
| 25 | 4 | 96 | 68.8 |
| 26 | 5 | 92 | 70.8 |
| 27 | 6 | 90 | 67 |
| 28 | 7 | 99 | 58.3 |
Step by Step Solution
There are 3 Steps involved in it
1 Expert Approved Answer
Step: 1 Unlock

Question Has Been Solved by an Expert!
Get step-by-step solutions from verified subject matter experts
Step: 2 Unlock
Step: 3 Unlock