

Question: not sure how to do the excel part , so please do 3 d. e. f. Second row, Third column All columns in second through
not sure how to do the excel part , so please do 3
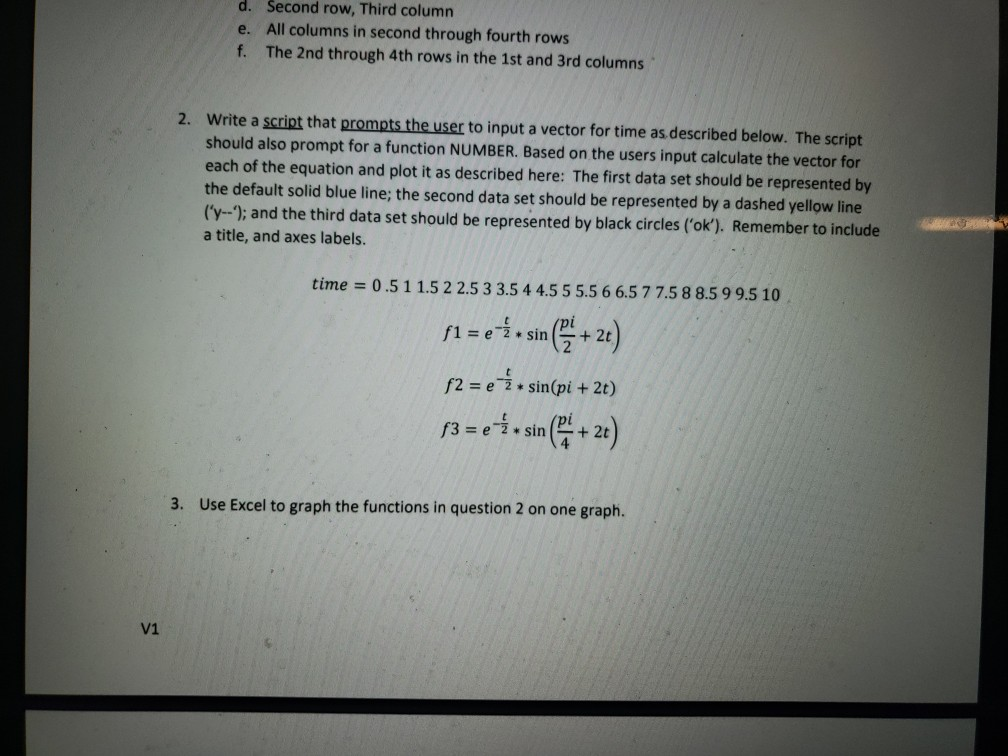
d. e. f. Second row, Third column All columns in second through fourth rows The 2nd through 4th rows in the 1st and 3rd columns 2. Write a script that prompts the user to input a vector for time as.described below. The script should also prompt for a function NUMBER. Based on the users input calculate the vector for each of the equation and plot it as described here: The first data set should be represented by the default solid blue line; the second data set should be represented by a dashed yellow line ('y; and the third data set should be represented by black circles ('ok). Remember to include a title, and axes labels. time 0.511.522.5 3 3.544.5 5 5.5 6 6.577.5 8 8.599.5 10 f2 e2 sin(pi + 2t) pi 3. Use Excel to graph the functions in question 2 on one graph. V1
Step by Step Solution
There are 3 Steps involved in it

Get step-by-step solutions from verified subject matter experts