

Question: not sure how to set up the excel sheet for this. below are the varibles for the excel sheet Plant Information: Plant 1: Production Cost
not sure how to set up the excel sheet for this. 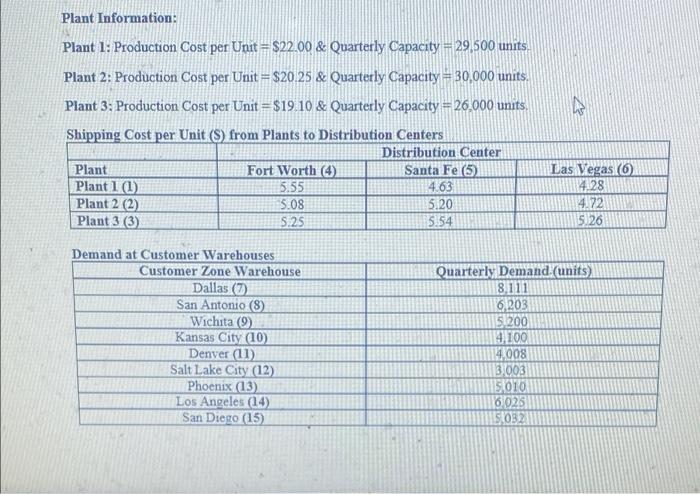
below are the varibles for the excel sheet 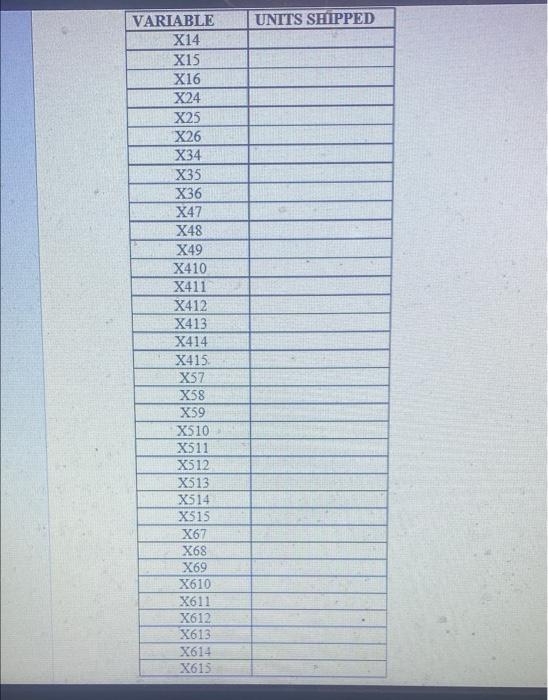
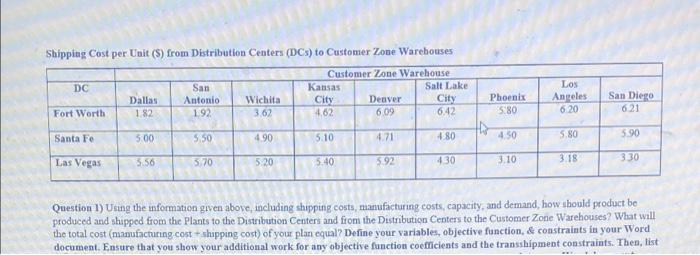
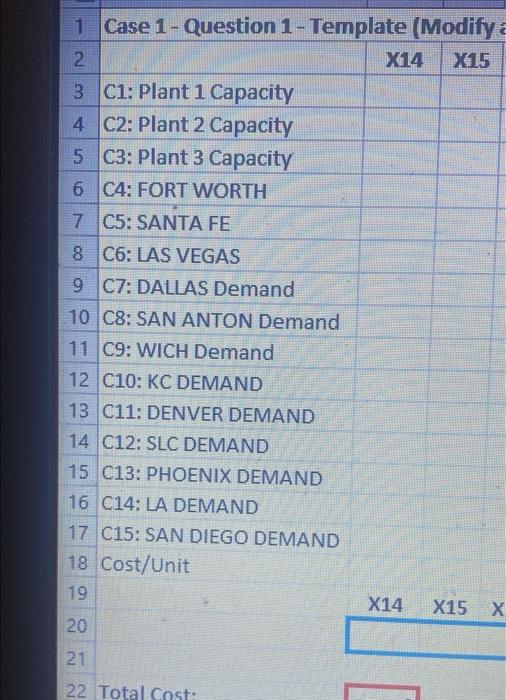
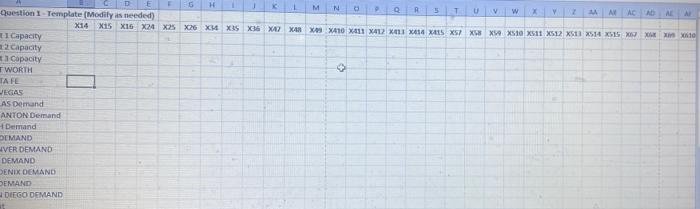
Plant Information: Plant 1: Production Cost per Unit = $22.00 & Quarterly Capacity - 29,500 units. Plant 2: Production Cost per Unit = $20.25 & Quarterly Capacity = 30,000 units. Plant 3: Production Cost per Unit = $19.10 & Quarterly Capacity = 26.000 units. Shipping Cost per Unit (S) from Plants to Distribution Centers Distribution Center Plant Fort Worth (4) Santa Fe (5) Plant 1 (1) 5.55 4.63 Plant 2 (2) 5.08 5.20 Plant 3 (3) 5.25 5.54 Las Vegas (6) 14.28 4.72 5.26 Demand at Customer Warehouses Customer Zone Warehouse Dallas (7) San Antonio (8) Wichita (9) Kansas City (10) Denver (11) Salt Lake City (12) Phoenix (13) Los Angeles (14) San Diego (15) Quarterly Demand. (units) 8,111 6 203 51200 4,100 4,008 3.003 15010 6025 S1032 Shipping Cost per Unit (S) from Distribution Centers (DCs) to Customer Zone Warebouses Customer Zone Warehouse DC San Kansas Salt Lake Dallas Antonio Wichita City Deaver City Fort Worth 182 192 3.62 4.62 6.42 Phoenix 5.80 Los Angeles 6.20 San Diego 6.21 6.09 5.00 Santa Fe 5.50 5.90 490 5.10 4.71 4.80 5.80 4.50 Las Vegas 5.56 5.70 5.20 5.40 5.92 430 3.10 3.18 330 Question 1) Using the information given above, including shipping costs, manufacturing costs, capacity and demand, how should product be produced and shipped from the plants to the Distribution Centers and from the Distribution Centers to the Customer Zone Warehouses? What will the total cost manufacturing.cost shipping cost of your plan equal? Define your variables, objective function, & constraints in your Word document. Ensure that you show your additional work for any objective function coefficients and the transshipment constraints. Then, list 1 Case 1 - Question 1- Template (Modify a 2 X14 X415 3 C1: Plant 1 Capacity 4 C2: Plant 2 Capacity 5 C3: Plant 3 Capacity 6 C4: FORT WORTH 7 C5: SANTA FE 8 C6: LAS VEGAS 9 07: DALLAS Demand 10 C8: SAN ANTON Demand 11 C9: WICH Demand 12 C10: KC DEMAND 13 C11: DENVER DEMAND 14 C12: SLC DEMAND 15 C13: PHOENIX DEMAND 16 C14: LA DEMAND 17 C15: SAN DIEGO DEMAND 18 Cost/Unit 19 X14 X15 20 21 2 22 Total Cast: - 6 - 3 - 3 - 3 02 . > E 6 H M N R 5 Question Template (Modily is needed) T U V Ao no A X14 X15 X16X24 X2 X6 X6 X5 X6 XA XANXA X410 X11 XL XL XA1 XS XS XXS XS10 X11 X512 X 514 XSIS XXX X10 1 Capacity a 2 Capacity 1 capacity WORTH TA FE LEGAS AS Demand ANTON Demand Demand DEMAND VER DEMAND DEMAND DENIX DEMAND DEMAND DIEGO DEMAND UNITS SHIPPED VARIABLE X14 X15 X16 X24 X25 X26 X34 X35 X36 X47 X48 X49 X410 X411 X412 X413 X414 X415 X57 X58 X59 X510 X511 X512 XS13 X514 X515 X67 X68 X69 X610 X611 X612 X613 X614 X615
Step by Step Solution
There are 3 Steps involved in it
1 Expert Approved Answer
Step: 1 Unlock

Question Has Been Solved by an Expert!
Get step-by-step solutions from verified subject matter experts
Step: 2 Unlock
Step: 3 Unlock