

Question: not sure if you need this spreadsheet or not begin{tabular}{|c|c|c|c|} hline Lambda - Arrival Rate (Calls per Minute) & Y & & hline Mu
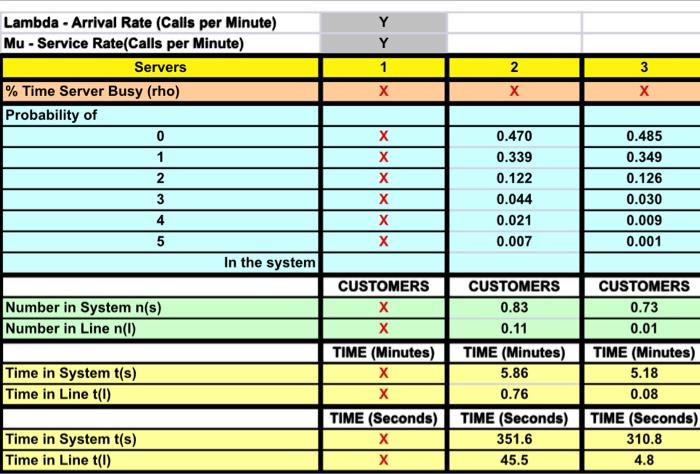
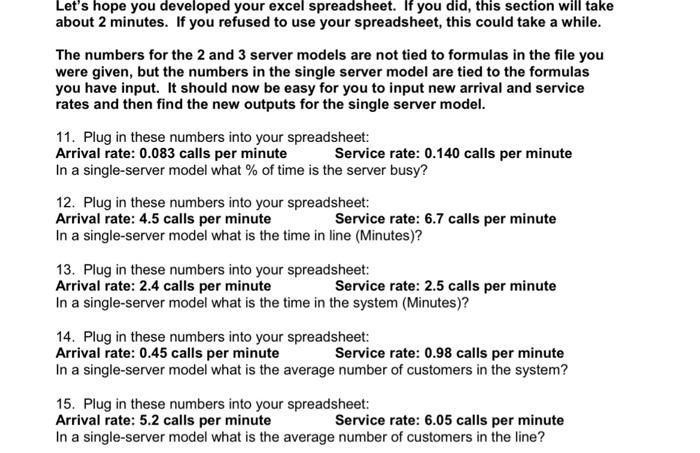
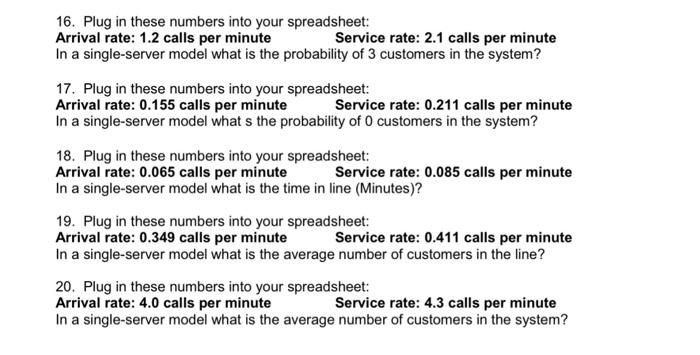
\begin{tabular}{|c|c|c|c|} \hline Lambda - Arrival Rate (Calls per Minute) & Y & & \\ \hline Mu - Service Rate(Calls per Minute) & Y & & \\ \hline Servers & 1 & 2 & 3 \\ \hline% Time Server Busy (rho) & X & X & X \\ \hline \multicolumn{4}{|l|}{ Probability of } \\ \hline 0 & X & 0.470 & 0.485 \\ \hline 1 & X & 0.339 & 0.349 \\ \hline 2 & x & 0.122 & 0.126 \\ \hline 3 & x & 0.044 & 0.030 \\ \hline 4 & X & 0.021 & 0.009 \\ \hline 5 & x & 0.007 & 0.001 \\ \hline \multicolumn{4}{|c|}{ In the system } \\ \hline & CUSTOMERS & CUSTOMERS & CUSTOMERS \\ \hline Number in System n(s) & x & 0.83 & 0.73 \\ \hline \multirow[t]{2}{*}{ Number in Line n(l)} & x & 0.11 & 0.01 \\ \hline & TIME (Minutes) & TIME (Minutes) & TIME (Minutes) \\ \hline Time in System t(s) & X & 5.86 & 5.18 \\ \hline \multirow[t]{2}{*}{ Time in Line t(I)} & x & 0.76 & 0.08 \\ \hline & TIME (Seconds) & TIME (Seconds) & TIME (Seconds) \\ \hline Time in System t(s) & x & 351.6 & 310.8 \\ \hline Time in Line t(I) & x & 45.5 & 4.8 \\ \hline \end{tabular} 16. Plug in these numbers into your spreadsheet: Arrival rate: 1.2 calls per minute Service rate: 2.1 calls per minute In a single-server model what is the probability of 3 customers in the system? 17. Plug in these numbers into your spreadsheet: Arrival rate: 0.155 calls per minute Service rate: 0.211 calls per minute In a single-server model what s the probability of 0 customers in the system? 18. Plug in these numbers into your spreadsheet: Arrival rate: 0.065 calls per minute Service rate: 0.085 calls per minute In a single-server model what is the time in line (Minutes)? 19. Plug in these numbers into your spreadsheet: Arrival rate: 0.349 calls per minute Service rate: 0.411 calls per minute In a single-server model what is the average number of customers in the line? 20. Plug in these numbers into your spreadsheet: Arrival rate: 4.0 calls per minute Service rate: 4.3 calls per minute In a single-server model what is the average number of customers in the system? about 2 minutes. If you refused to use your spreadsheet, this could take a while. The numbers for the 2 and 3 server models are not tied to formulas in the file you were given, but the numbers in the single server model are tied to the formulas you have input. It should now be easy for you to input new arrival and service rates and then find the new outputs for the single server model. 11. Plug in these numbers into your spreadsheet: Arrival rate: 0.083 calls per minute Service rate: 0.140 calls per minute In a single-server model what % of time is the server busy? 12. Plug in these numbers into your spreadsheet: Arrival rate: 4.5 calls per minute Service rate: 6.7 calls per minute In a single-server model what is the time in line (Minutes)? 13. Plug in these numbers into your spreadsheet: Arrival rate: 2.4 calls per minute Service rate: 2.5 calls per minute In a single-server model what is the time in the system (Minutes)? 14. Plug in these numbers into your spreadsheet: Arrival rate: 0.45 calls per minute Service rate: 0.98 calls per minute In a single-server model what is the average number of customers in the system? 15. Plug in these numbers into your spreadsheet: Arrival rate: 5.2 calls per minute Service rate: 6.05 calls per minute In a single-server model what is the average number of customers in the line
Step by Step Solution
There are 3 Steps involved in it

Get step-by-step solutions from verified subject matter experts