

Question: NOTE: Clearly label all plots (title, x-label, y-label, and legend). When using Python, use the plt.subplot command from Matplotlib when comparing 2 or more plots
NOTE:
Clearly label all plots (title, x-label, y-label, and legend).
When using Python, use the plt.subplot command from Matplotlib when comparing 2 or more plots to make comparisons easier.
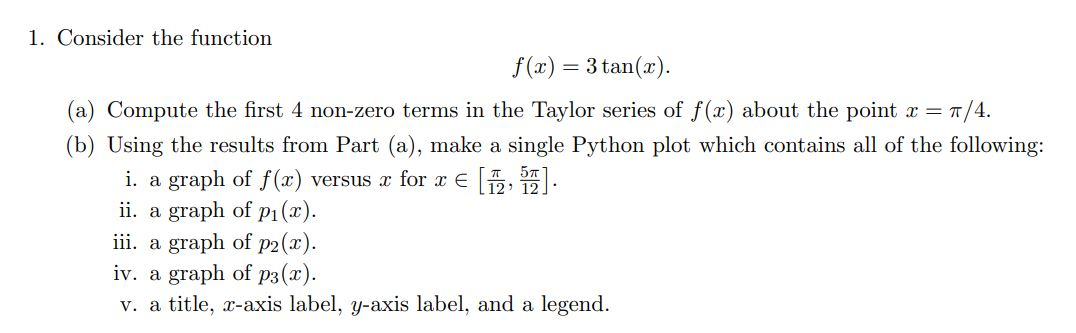
1. Consider the function f(x) = 3 tan(x). (a) Compute the first 4 non-zero terms in the Taylor series of f(2) about the point r= 7/4. (b) Using the results from Part (a), make a single Python plot which contains all of the following: i. a graph of f(x) versus x for x [7, 57). ii. a graph of p(x). iii. a graph of p2(2). iv. a graph of p3(x). v. a title, -axis label, y-axis label, and a legend. 1. Consider the function f(x) = 3 tan(x). (a) Compute the first 4 non-zero terms in the Taylor series of f(2) about the point r= 7/4. (b) Using the results from Part (a), make a single Python plot which contains all of the following: i. a graph of f(x) versus x for x [7, 57). ii. a graph of p(x). iii. a graph of p2(2). iv. a graph of p3(x). v. a title, -axis label, y-axis label, and a legend
Step by Step Solution
There are 3 Steps involved in it

Get step-by-step solutions from verified subject matter experts