

Question: NOTE: Figures are in (000s) except per share amounts 2004E 2001 86,426 $ 2005E 2006E 2007E 200BE 2009 2010E 2011E 2012E 2013E $ $ 28.9831
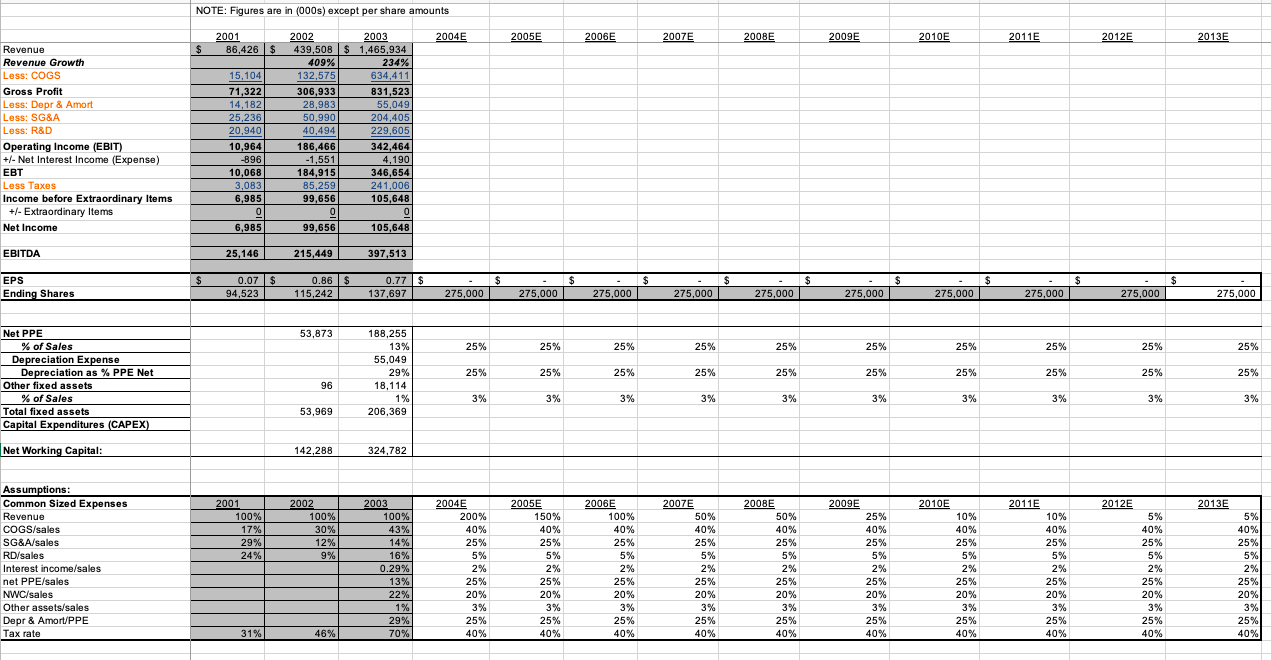
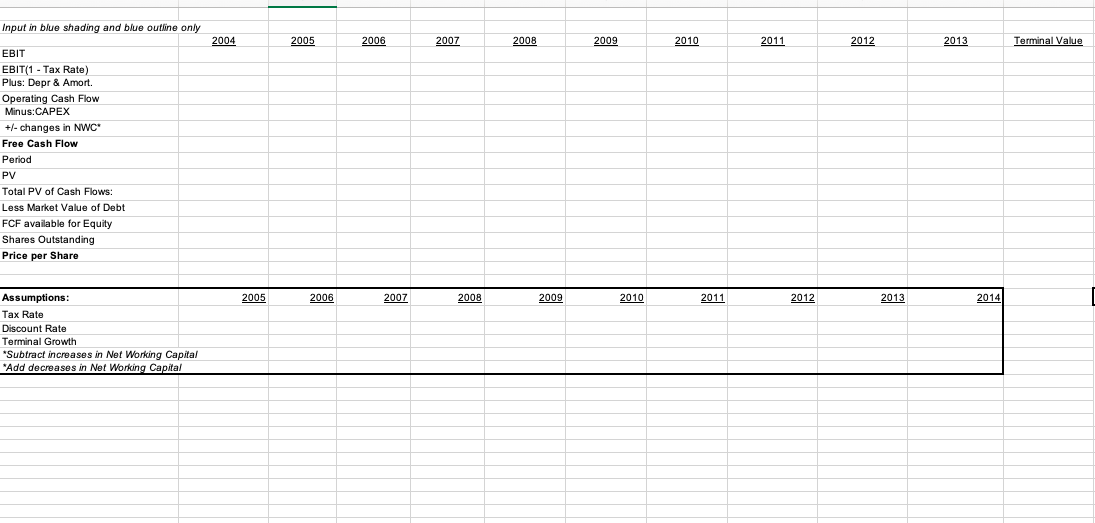
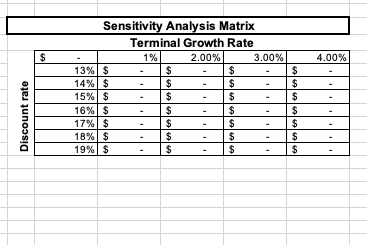
NOTE: Figures are in (000s) except per share amounts 2004E 2001 86,426 $ 2005E 2006E 2007E 200BE 2009 2010E 2011E 2012E 2013E $ $ 28.9831 Revenue Revenue Growth Less: COGS Gross Profit Less: Depr & Amort Less: SG&A Less: R&D Operating Income (EBIT) +/- Net Interest Income (Expense) EBT Less Taxes Income before Extraordinary Items +/- Extraordinary Items Net Income 15,104 71,322 14,182 25,236 20,940 10,964 -896 10,068 3,083 6,985 0 2002 2003 439,508 $ 1,465,934 409% 234% 132,575 634,411 306,933 831,523 55,0491 50,990 204,405 40,494 229,605 186.466 342,464 -1,551 4,190 184,915 346,654 85,259 241,006 99,656 105,648 0 0 99,656 105,648 6,985 EBITDA 25,146 215,449 397,513 $ $ $ $ $ $ $ $ EPS Ending Shares 0.07 $ 94,523 0.86$ 115.242 0.77 $ 137,697 $ 275,000 275,000 275,000 275,000 275,000 275,000 275,000 $ 275,000 275,000 275,000 53,873 25% 25% 25% 25% 25% 25% 25% 25% 25% 25% 188,255 13% 55,049 29% 18,114 1% 206,369 25% 25% 25% 25% 25% 25% 25% 25% 25% Net PPE % of Sales Depreciation Expense Depreciation as % PPE Net Other fixed assets % of Sales Total fixed assets Capital Expenditures (CAPEX) 25% 96 3% 3% 3% 3% 3% 3% 3% 3% 3% 3% 53,969 Net Working Capital: 142,288 324,782 2011E 2012E 012 2013E 2001 100% 17% 29% 24% 2002 100% 30% 12% 9% 9 Assumptions: Common Sized Expenses Revenue COGS/sales SG&A/sales RD/sales Interest income/sales net PPE/sales NWC/sales Other assets/sales Depr & Amort/PPE Tax rate 2003 100% 43% 14% 16% 0.29% 13% 22% 1% 29% 70% 2004E 200% 40% 25% 5% 2% 25% 20% 3% 25% 40% 2005E 150% 40% 25% 5% 2% 25% 20% 3% 25% 40% 2006E 100% 40% 25% 5% 2% 25% 20% 3% 25% 40% 2007E 50% 40% 25% 5% 2% 25% 20% 3% 25% 40% 2008E 50% 40% 25% 5% 2% 25% 20% 3% 25% 40% 2009E 25% 40% 25% 5% 2% 25% 20% 3% 25% 40% 2010E 10% 40% 25% 5% 2% 25% 20% 3% 25% 40% 2011E 10% 40% 25% 5% 2% 25% 20% 3% 25% 40% 5% 40% 25% 5% 2 25% 20% 3% 25% 40% 40% 25% % 5% 2% 25% 20% 3% 25% 40% 31% 46% Input in blue shading and blue outline only 2004 2005 2006 2007 2008 2009 2010 2011 2012 2013 Terminal Value EBIT EBIT(1 - Tax Rate) Plus: Depr & Amort. Operating Cash Flow Minus:CAPEX +/- changes in NWC Free Cash Flow Period PV Total PV of Cash Flows: Total Less Market Value of Debt FCF available for Equity Shares Outstanding Price per Share 2005 2006 2007 2008 2009 2010 2011 2012 2013 2014 Assumptions: Tax Rate Discount Rate Terminal Growth *Subtract increases in Net Working Capital *Add decreases in Net Working Capital $ $ 4.00% Discount rate Sensitivity Analysis Matrix Terminal Growth Rate 1% 2.00% 3.00% 13% $ $ $ 14% $ $ $ 15%$ $ $ 16% $ $ $ 17% $ $ $ 18% $ $ $ 19% $ $ $ $ $ $ $ $ $ $ NOTE: Figures are in (000s) except per share amounts 2004E 2001 86,426 $ 2005E 2006E 2007E 200BE 2009 2010E 2011E 2012E 2013E $ $ 28.9831 Revenue Revenue Growth Less: COGS Gross Profit Less: Depr & Amort Less: SG&A Less: R&D Operating Income (EBIT) +/- Net Interest Income (Expense) EBT Less Taxes Income before Extraordinary Items +/- Extraordinary Items Net Income 15,104 71,322 14,182 25,236 20,940 10,964 -896 10,068 3,083 6,985 0 2002 2003 439,508 $ 1,465,934 409% 234% 132,575 634,411 306,933 831,523 55,0491 50,990 204,405 40,494 229,605 186.466 342,464 -1,551 4,190 184,915 346,654 85,259 241,006 99,656 105,648 0 0 99,656 105,648 6,985 EBITDA 25,146 215,449 397,513 $ $ $ $ $ $ $ $ EPS Ending Shares 0.07 $ 94,523 0.86$ 115.242 0.77 $ 137,697 $ 275,000 275,000 275,000 275,000 275,000 275,000 275,000 $ 275,000 275,000 275,000 53,873 25% 25% 25% 25% 25% 25% 25% 25% 25% 25% 188,255 13% 55,049 29% 18,114 1% 206,369 25% 25% 25% 25% 25% 25% 25% 25% 25% Net PPE % of Sales Depreciation Expense Depreciation as % PPE Net Other fixed assets % of Sales Total fixed assets Capital Expenditures (CAPEX) 25% 96 3% 3% 3% 3% 3% 3% 3% 3% 3% 3% 53,969 Net Working Capital: 142,288 324,782 2011E 2012E 012 2013E 2001 100% 17% 29% 24% 2002 100% 30% 12% 9% 9 Assumptions: Common Sized Expenses Revenue COGS/sales SG&A/sales RD/sales Interest income/sales net PPE/sales NWC/sales Other assets/sales Depr & Amort/PPE Tax rate 2003 100% 43% 14% 16% 0.29% 13% 22% 1% 29% 70% 2004E 200% 40% 25% 5% 2% 25% 20% 3% 25% 40% 2005E 150% 40% 25% 5% 2% 25% 20% 3% 25% 40% 2006E 100% 40% 25% 5% 2% 25% 20% 3% 25% 40% 2007E 50% 40% 25% 5% 2% 25% 20% 3% 25% 40% 2008E 50% 40% 25% 5% 2% 25% 20% 3% 25% 40% 2009E 25% 40% 25% 5% 2% 25% 20% 3% 25% 40% 2010E 10% 40% 25% 5% 2% 25% 20% 3% 25% 40% 2011E 10% 40% 25% 5% 2% 25% 20% 3% 25% 40% 5% 40% 25% 5% 2 25% 20% 3% 25% 40% 40% 25% % 5% 2% 25% 20% 3% 25% 40% 31% 46% Input in blue shading and blue outline only 2004 2005 2006 2007 2008 2009 2010 2011 2012 2013 Terminal Value EBIT EBIT(1 - Tax Rate) Plus: Depr & Amort. Operating Cash Flow Minus:CAPEX +/- changes in NWC Free Cash Flow Period PV Total PV of Cash Flows: Total Less Market Value of Debt FCF available for Equity Shares Outstanding Price per Share 2005 2006 2007 2008 2009 2010 2011 2012 2013 2014 Assumptions: Tax Rate Discount Rate Terminal Growth *Subtract increases in Net Working Capital *Add decreases in Net Working Capital $ $ 4.00% Discount rate Sensitivity Analysis Matrix Terminal Growth Rate 1% 2.00% 3.00% 13% $ $ $ 14% $ $ $ 15%$ $ $ 16% $ $ $ 17% $ $ $ 18% $ $ $ 19% $ $ $ $ $ $ $ $ $ $
Step by Step Solution
There are 3 Steps involved in it

Get step-by-step solutions from verified subject matter experts