

Question: Note: If the image appears too small you can right click and open the image in a new tab! Refer to Table 56.1 - Factors
 Note: If the image appears too small you can right click and open the image in a new tab!
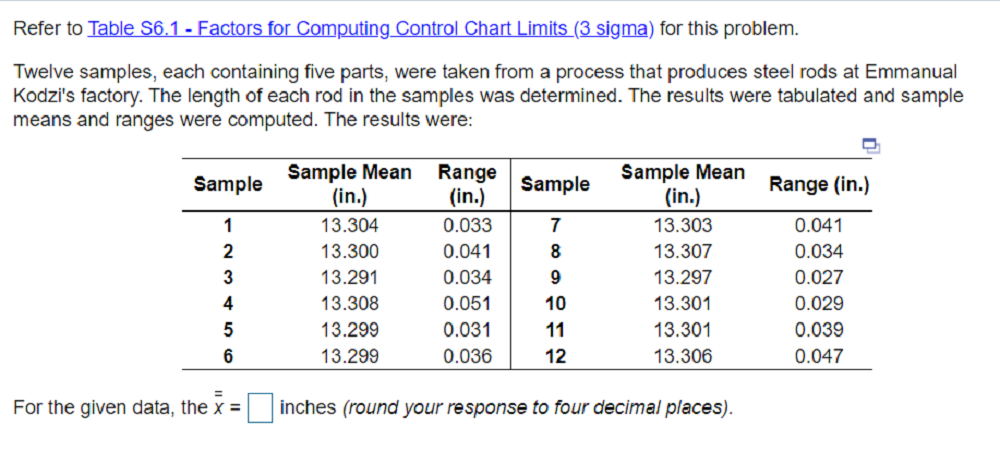
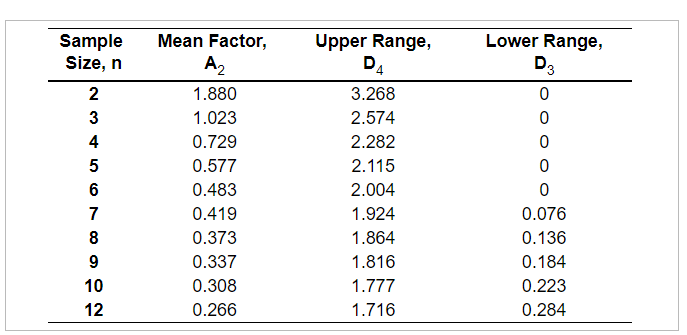
Refer to Table 56.1 - Factors for Computing Control Chart Limits (3 sigma) for this problem. Twelve samples, each containing five parts, were taken from a process that produces steel rods at Emmanual Kodzi's factory. The length of each rod in the samples was determined. The results were tabulated and sample means and ranges were computed. The results were: Sample Sample Range (in.) 1 2 7 8 Sample Mean (in.) 13.304 13.300 13.291 13.308 13.299 13.299 Range (in.) 0.033 0.041 0.034 0.051 0.031 0.036 Sample Mean (in.) 13.303 13.307 13.297 13.301 13.301 13.306 3 0.041 0.034 0.027 0.029 0.039 0.047 9 10 11 12 4 5 6 For the given data, the x = inches (round your response to four decimal places). Sample Size, n Upper Range, DA 2 3 4 5 6 7 8 9 Mean Factor, A2 1.880 1.023 0.729 0.577 0.483 0.419 0.373 0.337 0.308 0.266 3.268 2.574 2.282 2.115 2.004 1.924 1.864 1.816 1.777 1.716 Lower Range, D: 0 0 0 0 0 0.076 0.136 0.184 0.223 0.284 10 12
Step by Step Solution
There are 3 Steps involved in it

Get step-by-step solutions from verified subject matter experts