

Question: Note: Line segments will automatically connect the points. Remember to plot from left to right. GO A 50 Andrew's Supply 40 Beth's Supply -0 PRICE

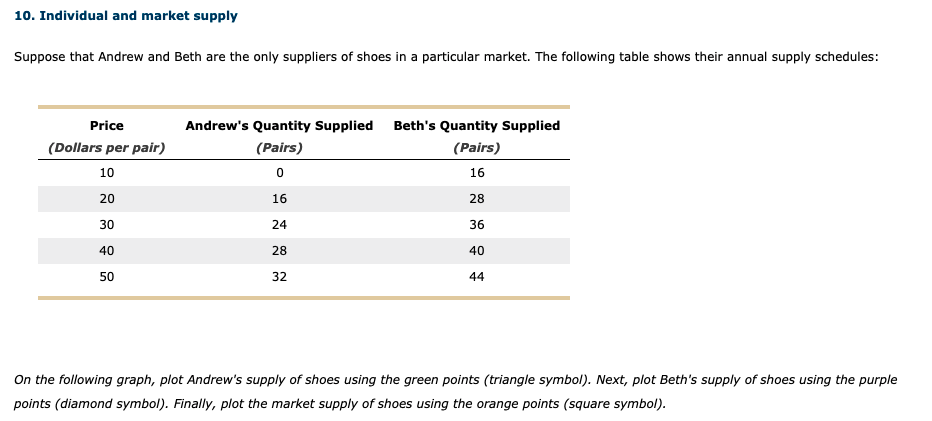

Note: Line segments will automatically connect the points. Remember to plot from left to right. GO A 50 Andrew's Supply 40 Beth's Supply -0 PRICE (Dollars per pair) 30 Market Supply 20 10 0 16 32 48 64 96 QUANTITY (Pairs)10. Individual and market supply Suppose that Andrew and Beth are the only suppliers of shoes in a particular market. The following table shows their annual supply schedules: Price Andrew's Quantity Supplied Beth's Quantity Supplied ( Dollars per pair) (Pairs) (Pairs) 10 0 16 20 16 28 30 24 36 40 28 40 50 32 44 On the following graph, plot Andrew's supply of shoes using the green points (triangle symbol). Next, plot Beth's supply of shoes using the purple points (diamond symbol). Finally, plot the market supply of shoes using the orange points (square symbol)
Step by Step Solution
There are 3 Steps involved in it

Get step-by-step solutions from verified subject matter experts