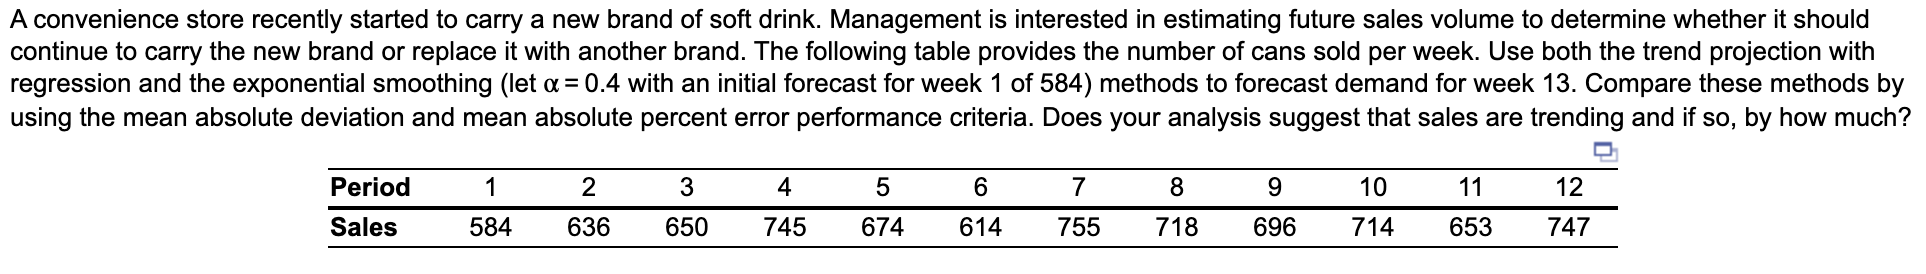
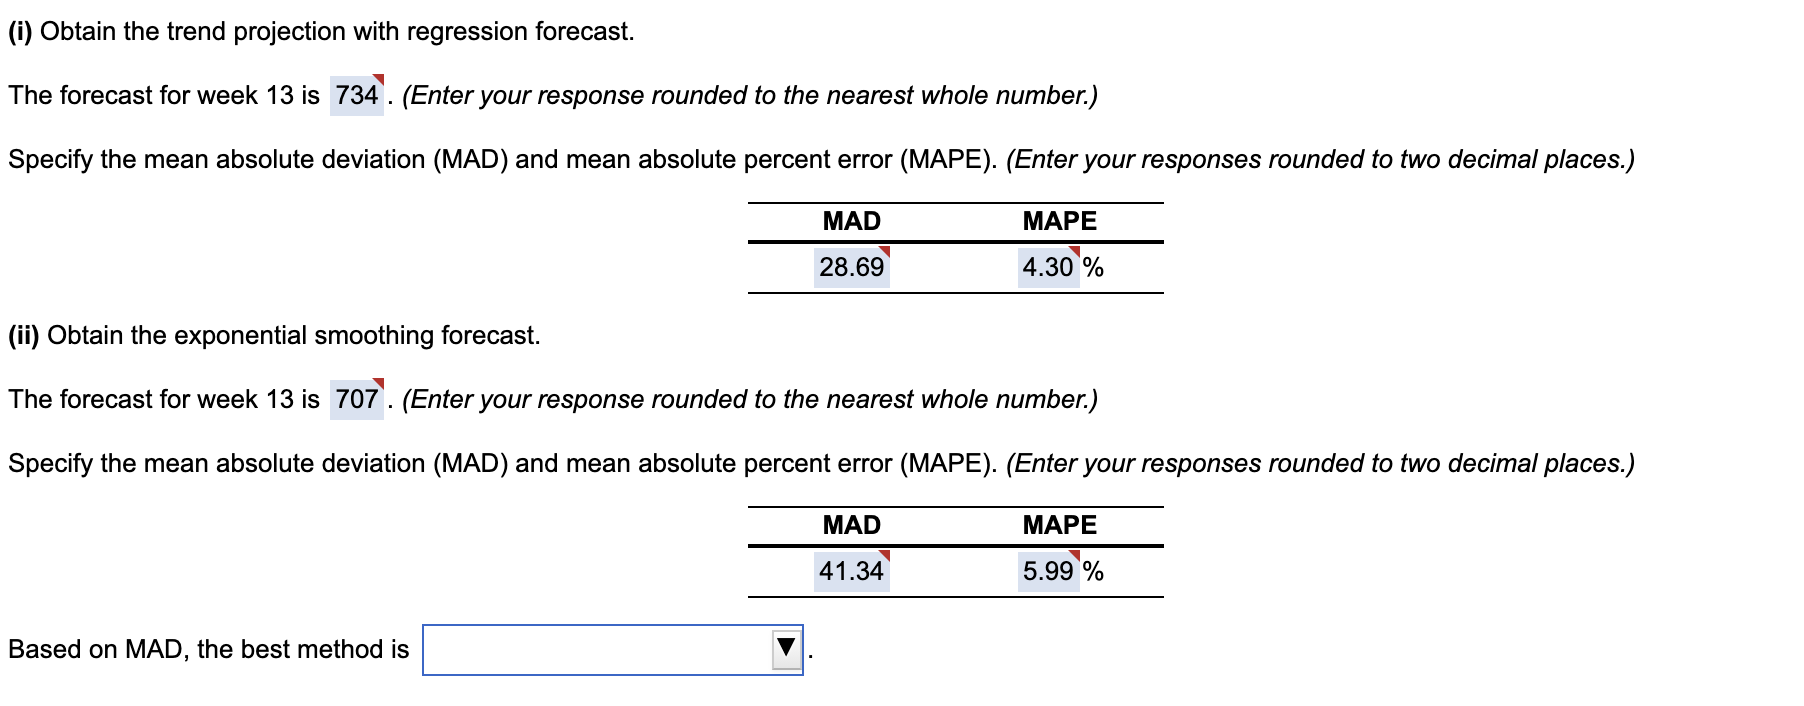
Question: **Note: Please ignore my inputs. A convenience store recently started to carry a new brand of soft drink. Management is interested in estimating future sales

**Note: Please ignore my inputs. A convenience**Note: Please ignore my inputs. A convenience**Note: Please ignore my inputs.

A convenience store recently started to carry a new brand of soft drink. Management is interested in estimating future sales volume to determine whether it should continue to carry the new brand or replace it with another brand. The following table provides the number of cans sold per week. Use both the trend projection with regression and the exponential smoothing (let a = 0.4 with an initial forecast for week 1 of 584) methods to forecast demand for week 13. Compare these methods by using the mean absolute deviation and mean absolute percent error performance criteria. Does your analysis suggest that sales are trending and if so, by how much? Period 1 2 3 4 5 6 7 8 9 10 11 12 Sales 584 636 650 745 674 614 755 718 696 714 653 747 (i) Obtain the trend projection with regression forecast. The forecast for week 13 is 734. (Enter your response rounded to the nearest whole number.) Specify the mean absolute deviation (MAD) and mean absolute percent error (MAPE). (Enter your responses rounded to two decimal places.) MAD MAPE 28.69 4.30% (ii) Obtain the exponential smoothing forecast. The forecast for week 13 is 707. (Enter your response rounded to the nearest whole number.) Specify the mean olute deviation (MAD) and mean absolute percent error (MAPE). (Enter your responses rounded to two decimal places.) MAD MAPE 41.34 5.99 % Based on MAD, the best method is

Step by Step Solution

There are 3 Steps involved in it

1 Expert Approved Answer
Step: 1 Unlock blur-text-image
Question Has Been Solved by an Expert!

Get step-by-step solutions from verified subject matter experts

Step: 2 Unlock
Step: 3 Unlock

Students Have Also Explored These Related General Management Questions!